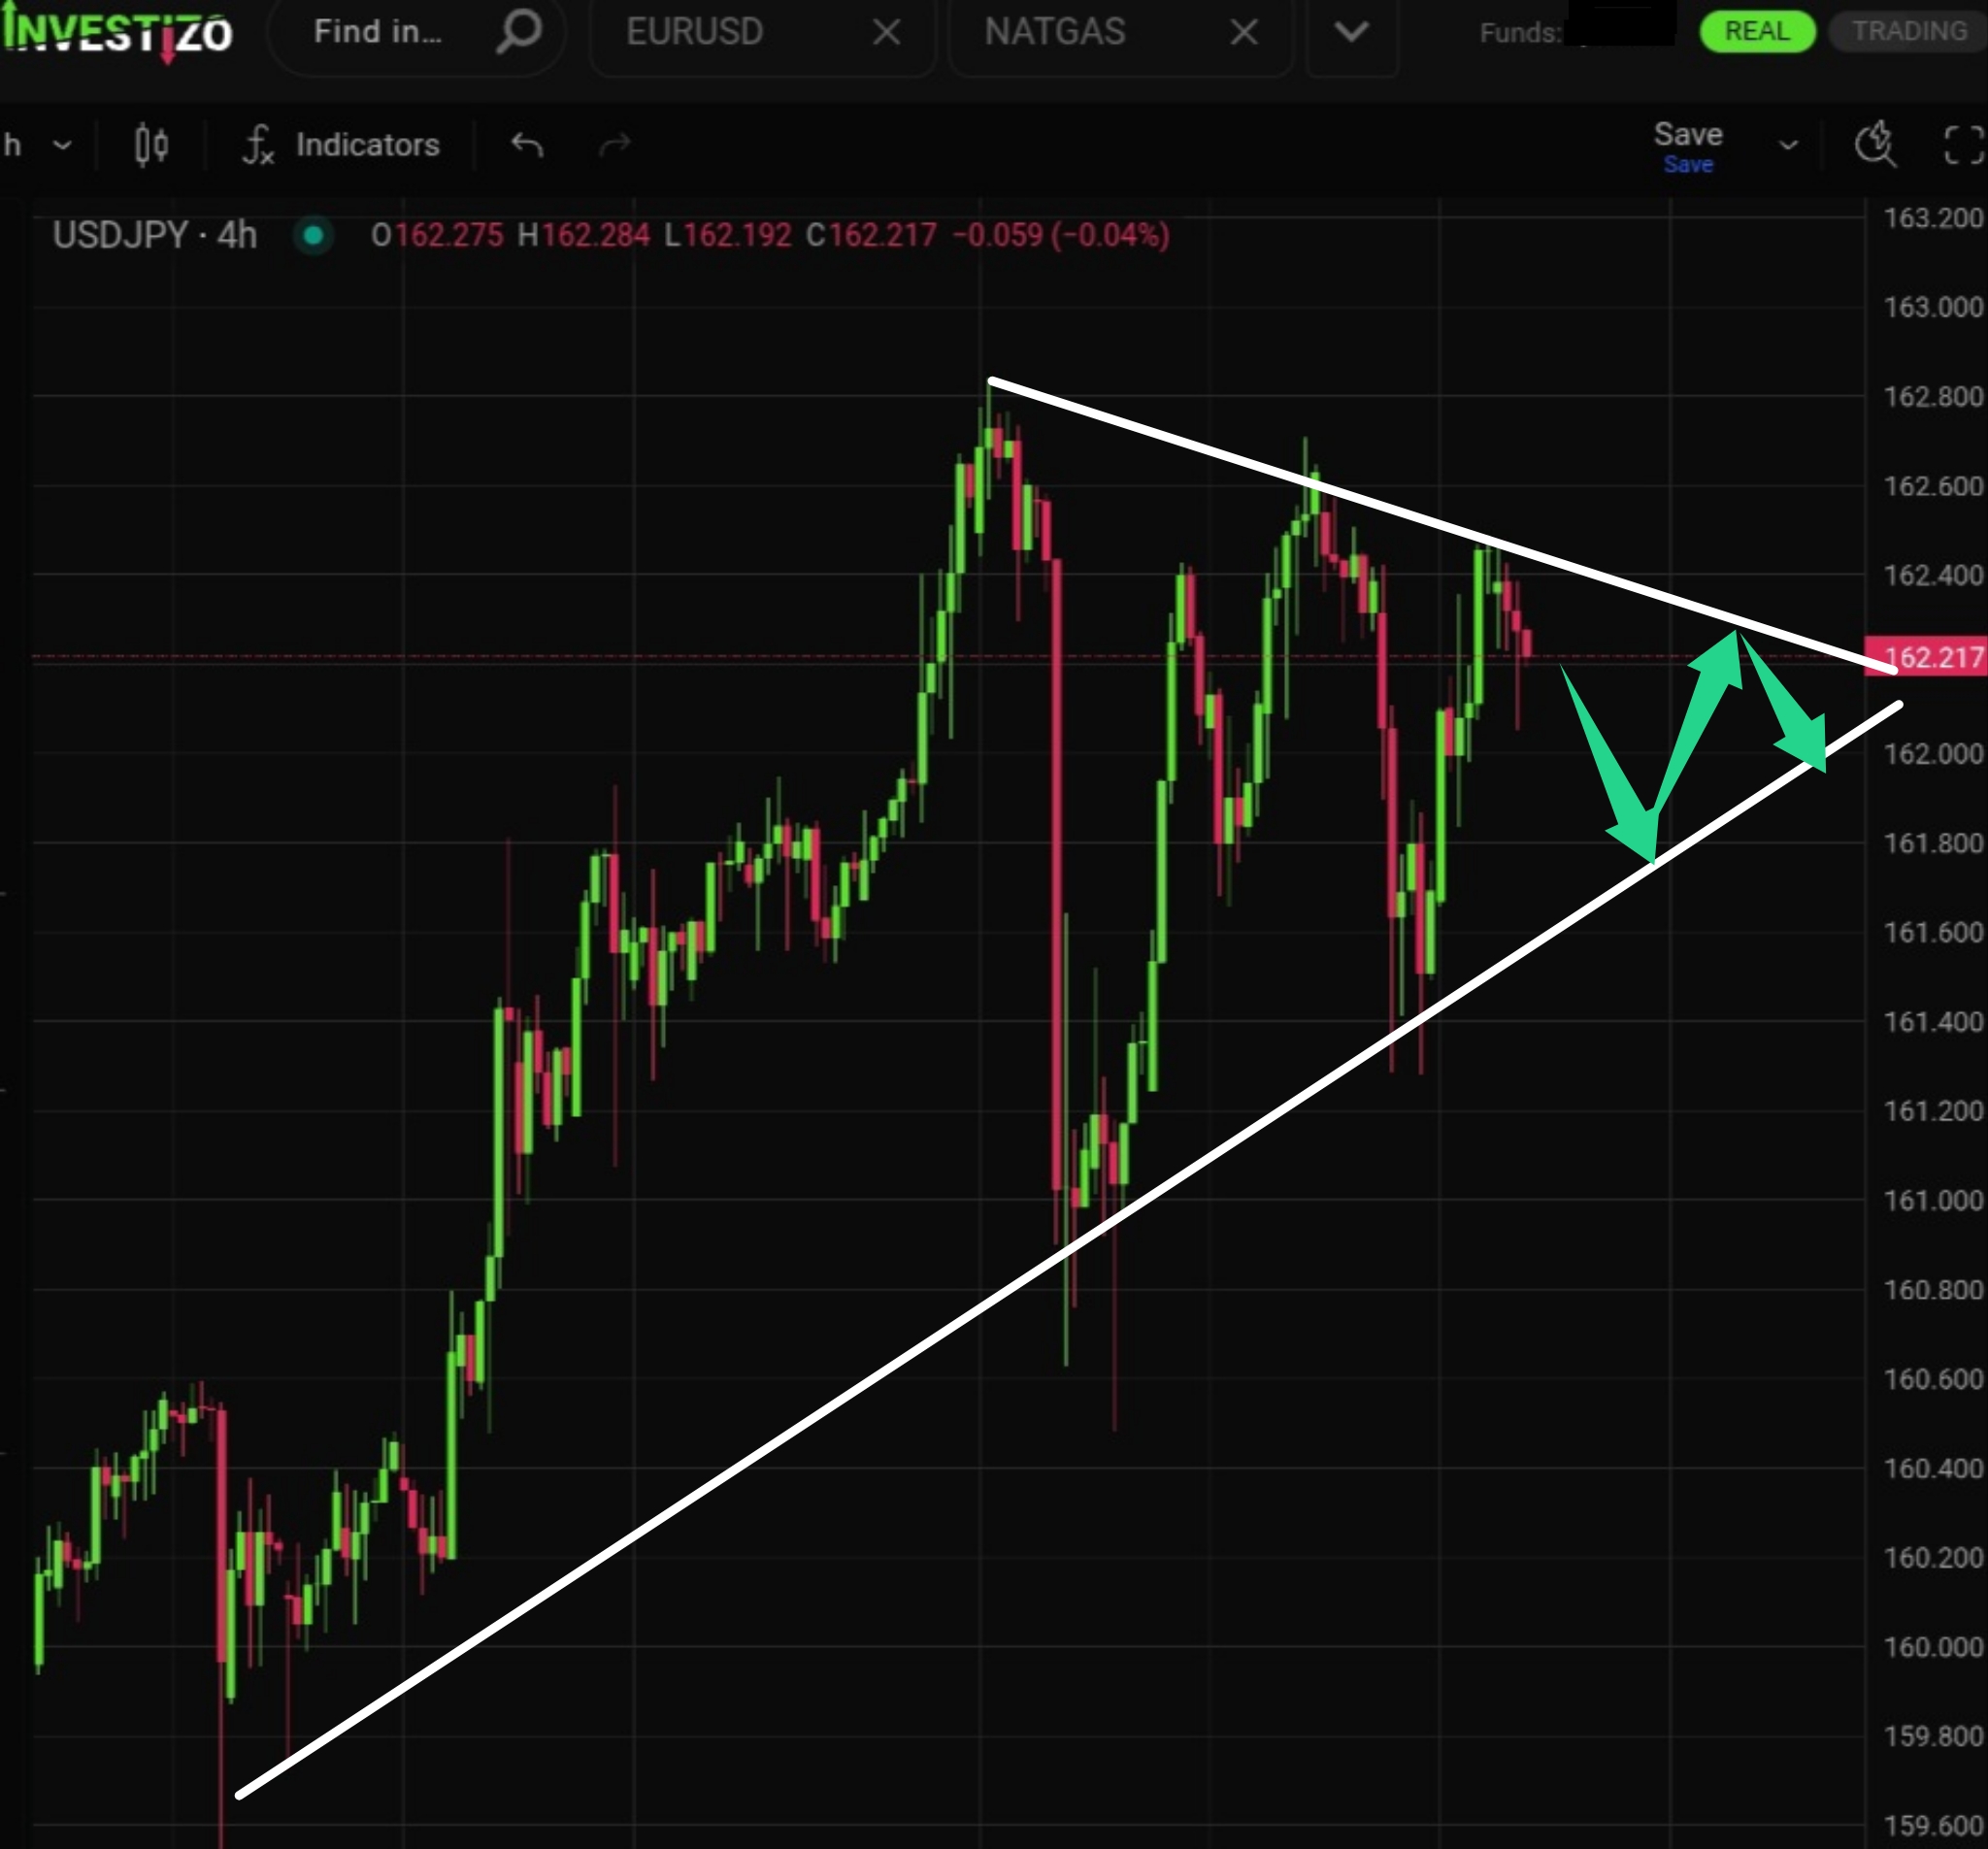
USD/JPY, Technical Analysis – H4
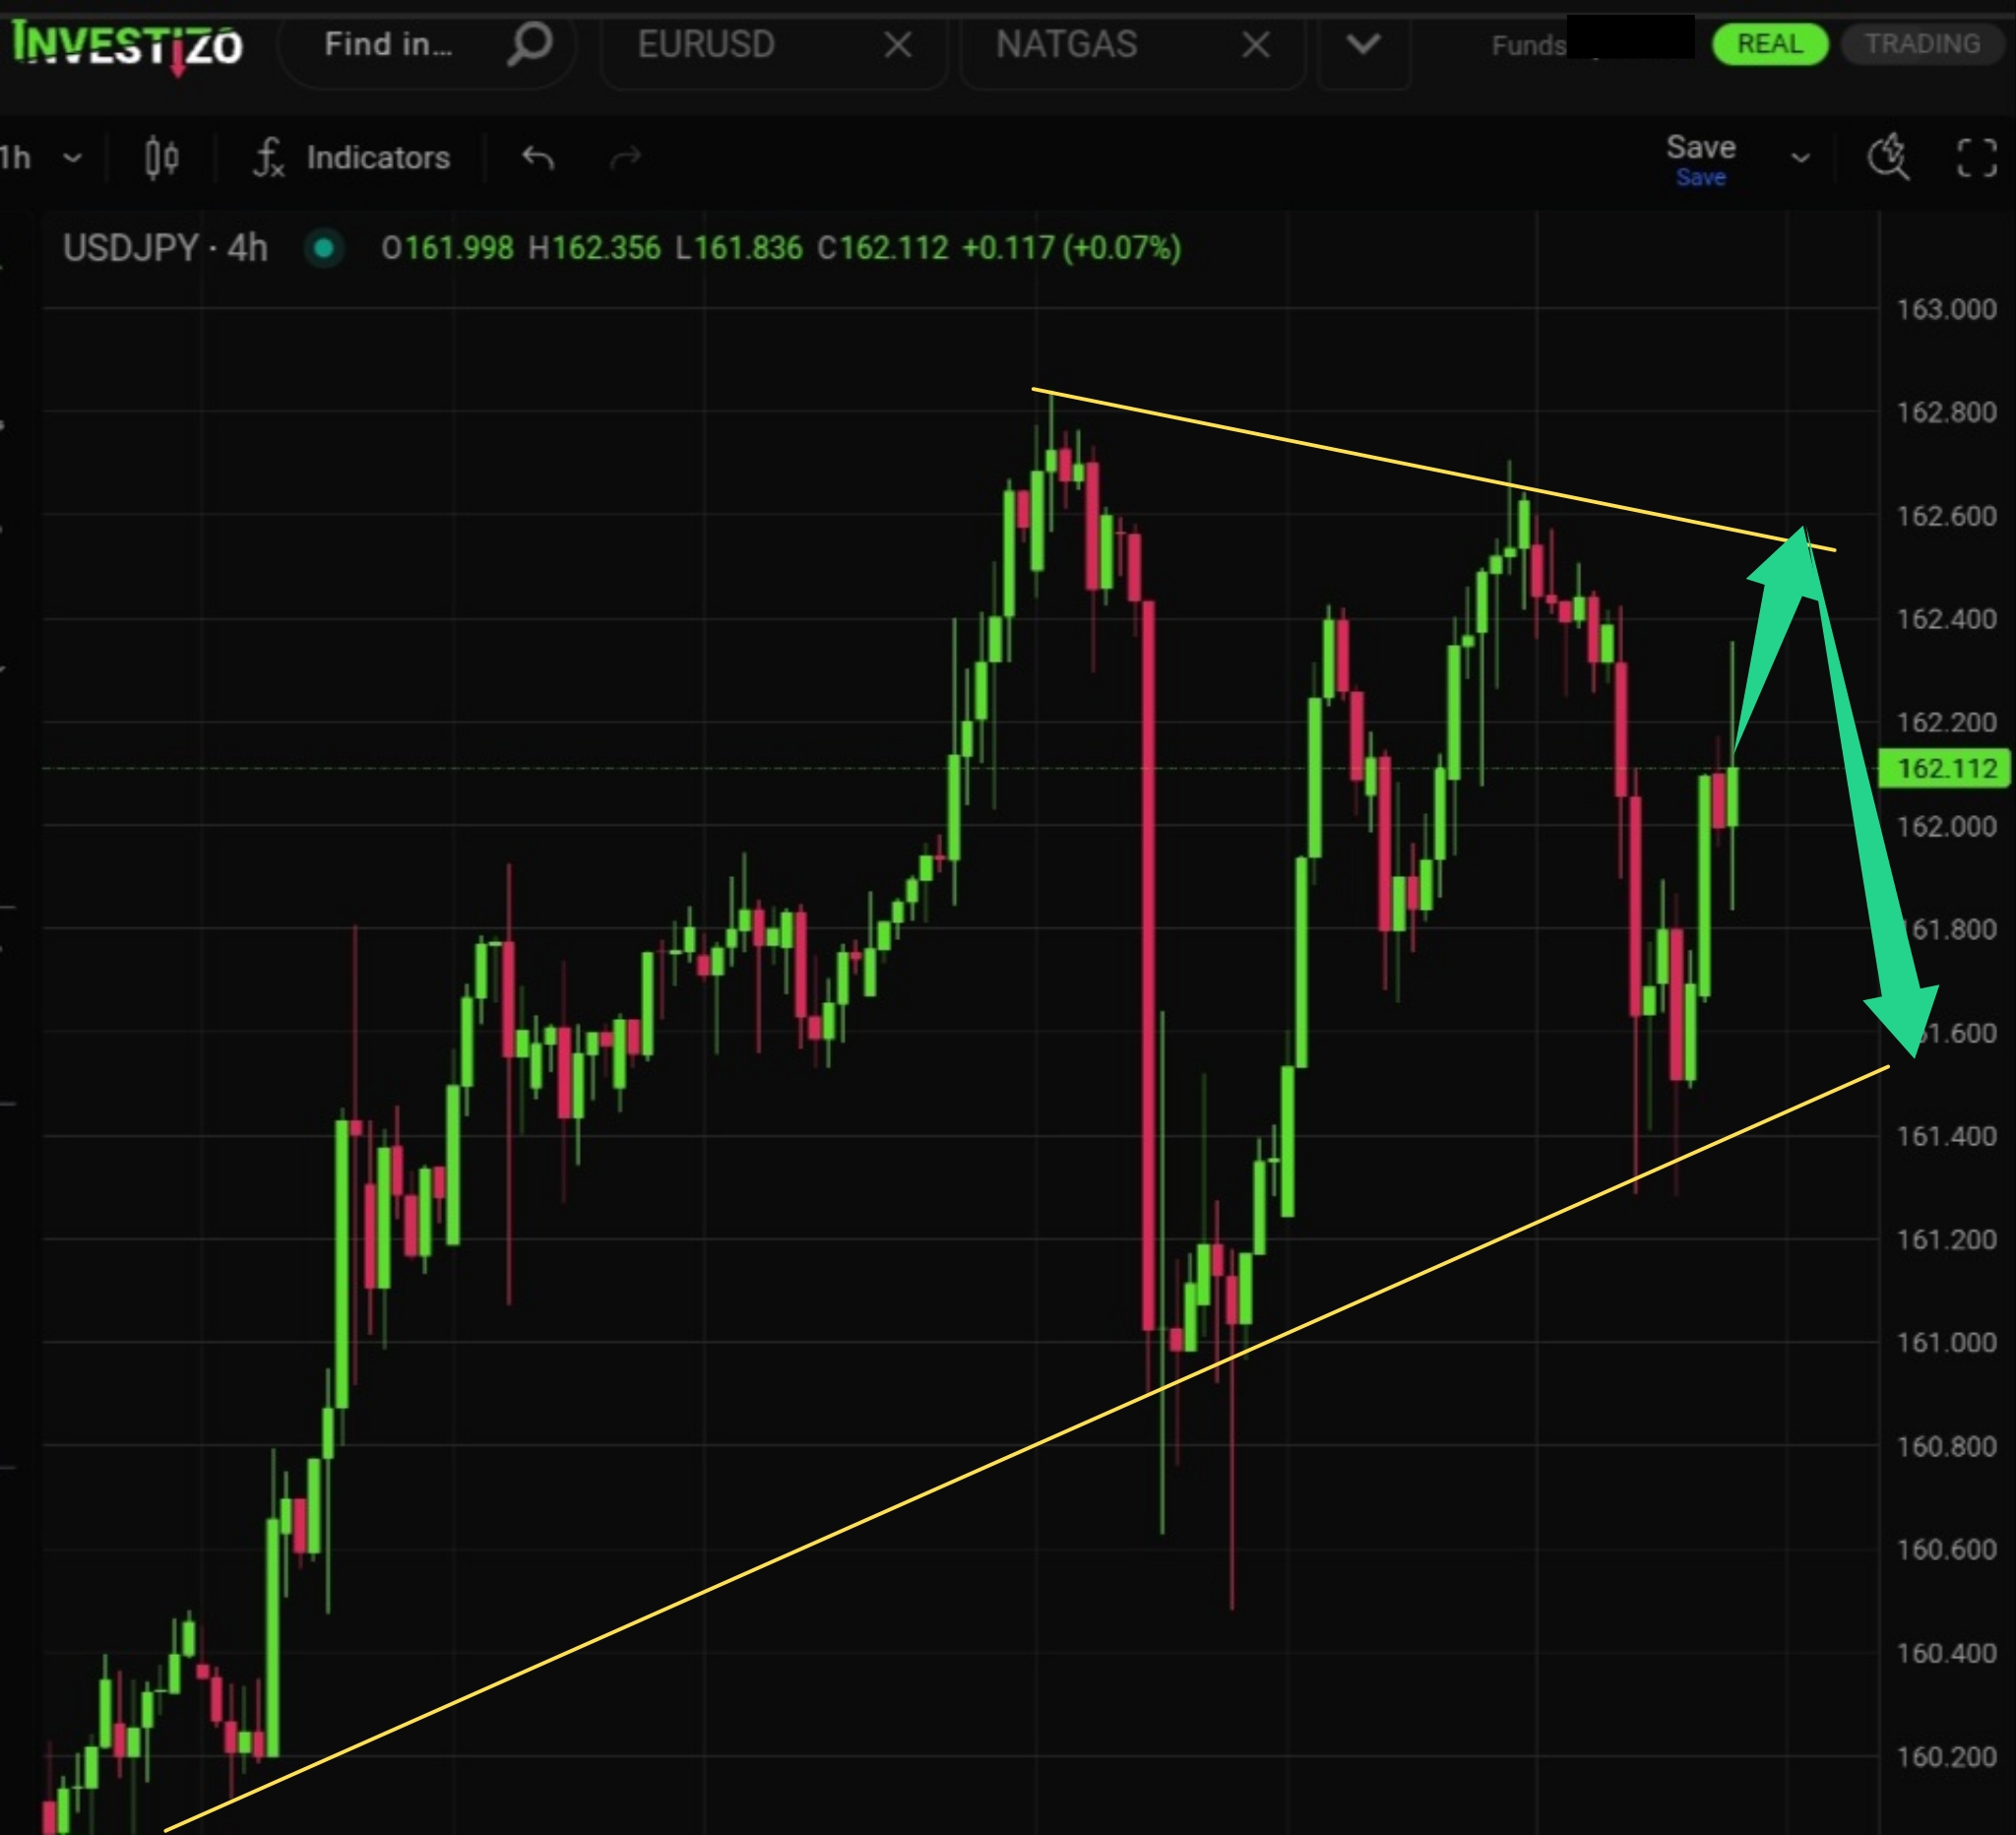
The pair continues to consolidate inside a narrowing triangular range between 161.800 and 162.400.
Investizo LTD. Business company number 25432 BC 2019
Suite 305, Griffith Corporate Centre,
P.O. Box 1510, Beachmont, Kingstown,
St. Vincent and the Grenadines
DUNS 817053497
Phone:+996312610515
E-mail: [email protected]
© 2019-2026 Investizo 18+ All rights reserved
Risk Warning: CFDs are complex financial products traded on margin. Trading CFDs is risky and may not be suitable for all investors. Ensure you understand the risks involved as you may lose all your invested capital.
The pair continues to consolidate inside a narrowing triangular range between 161.800 and 162.400.
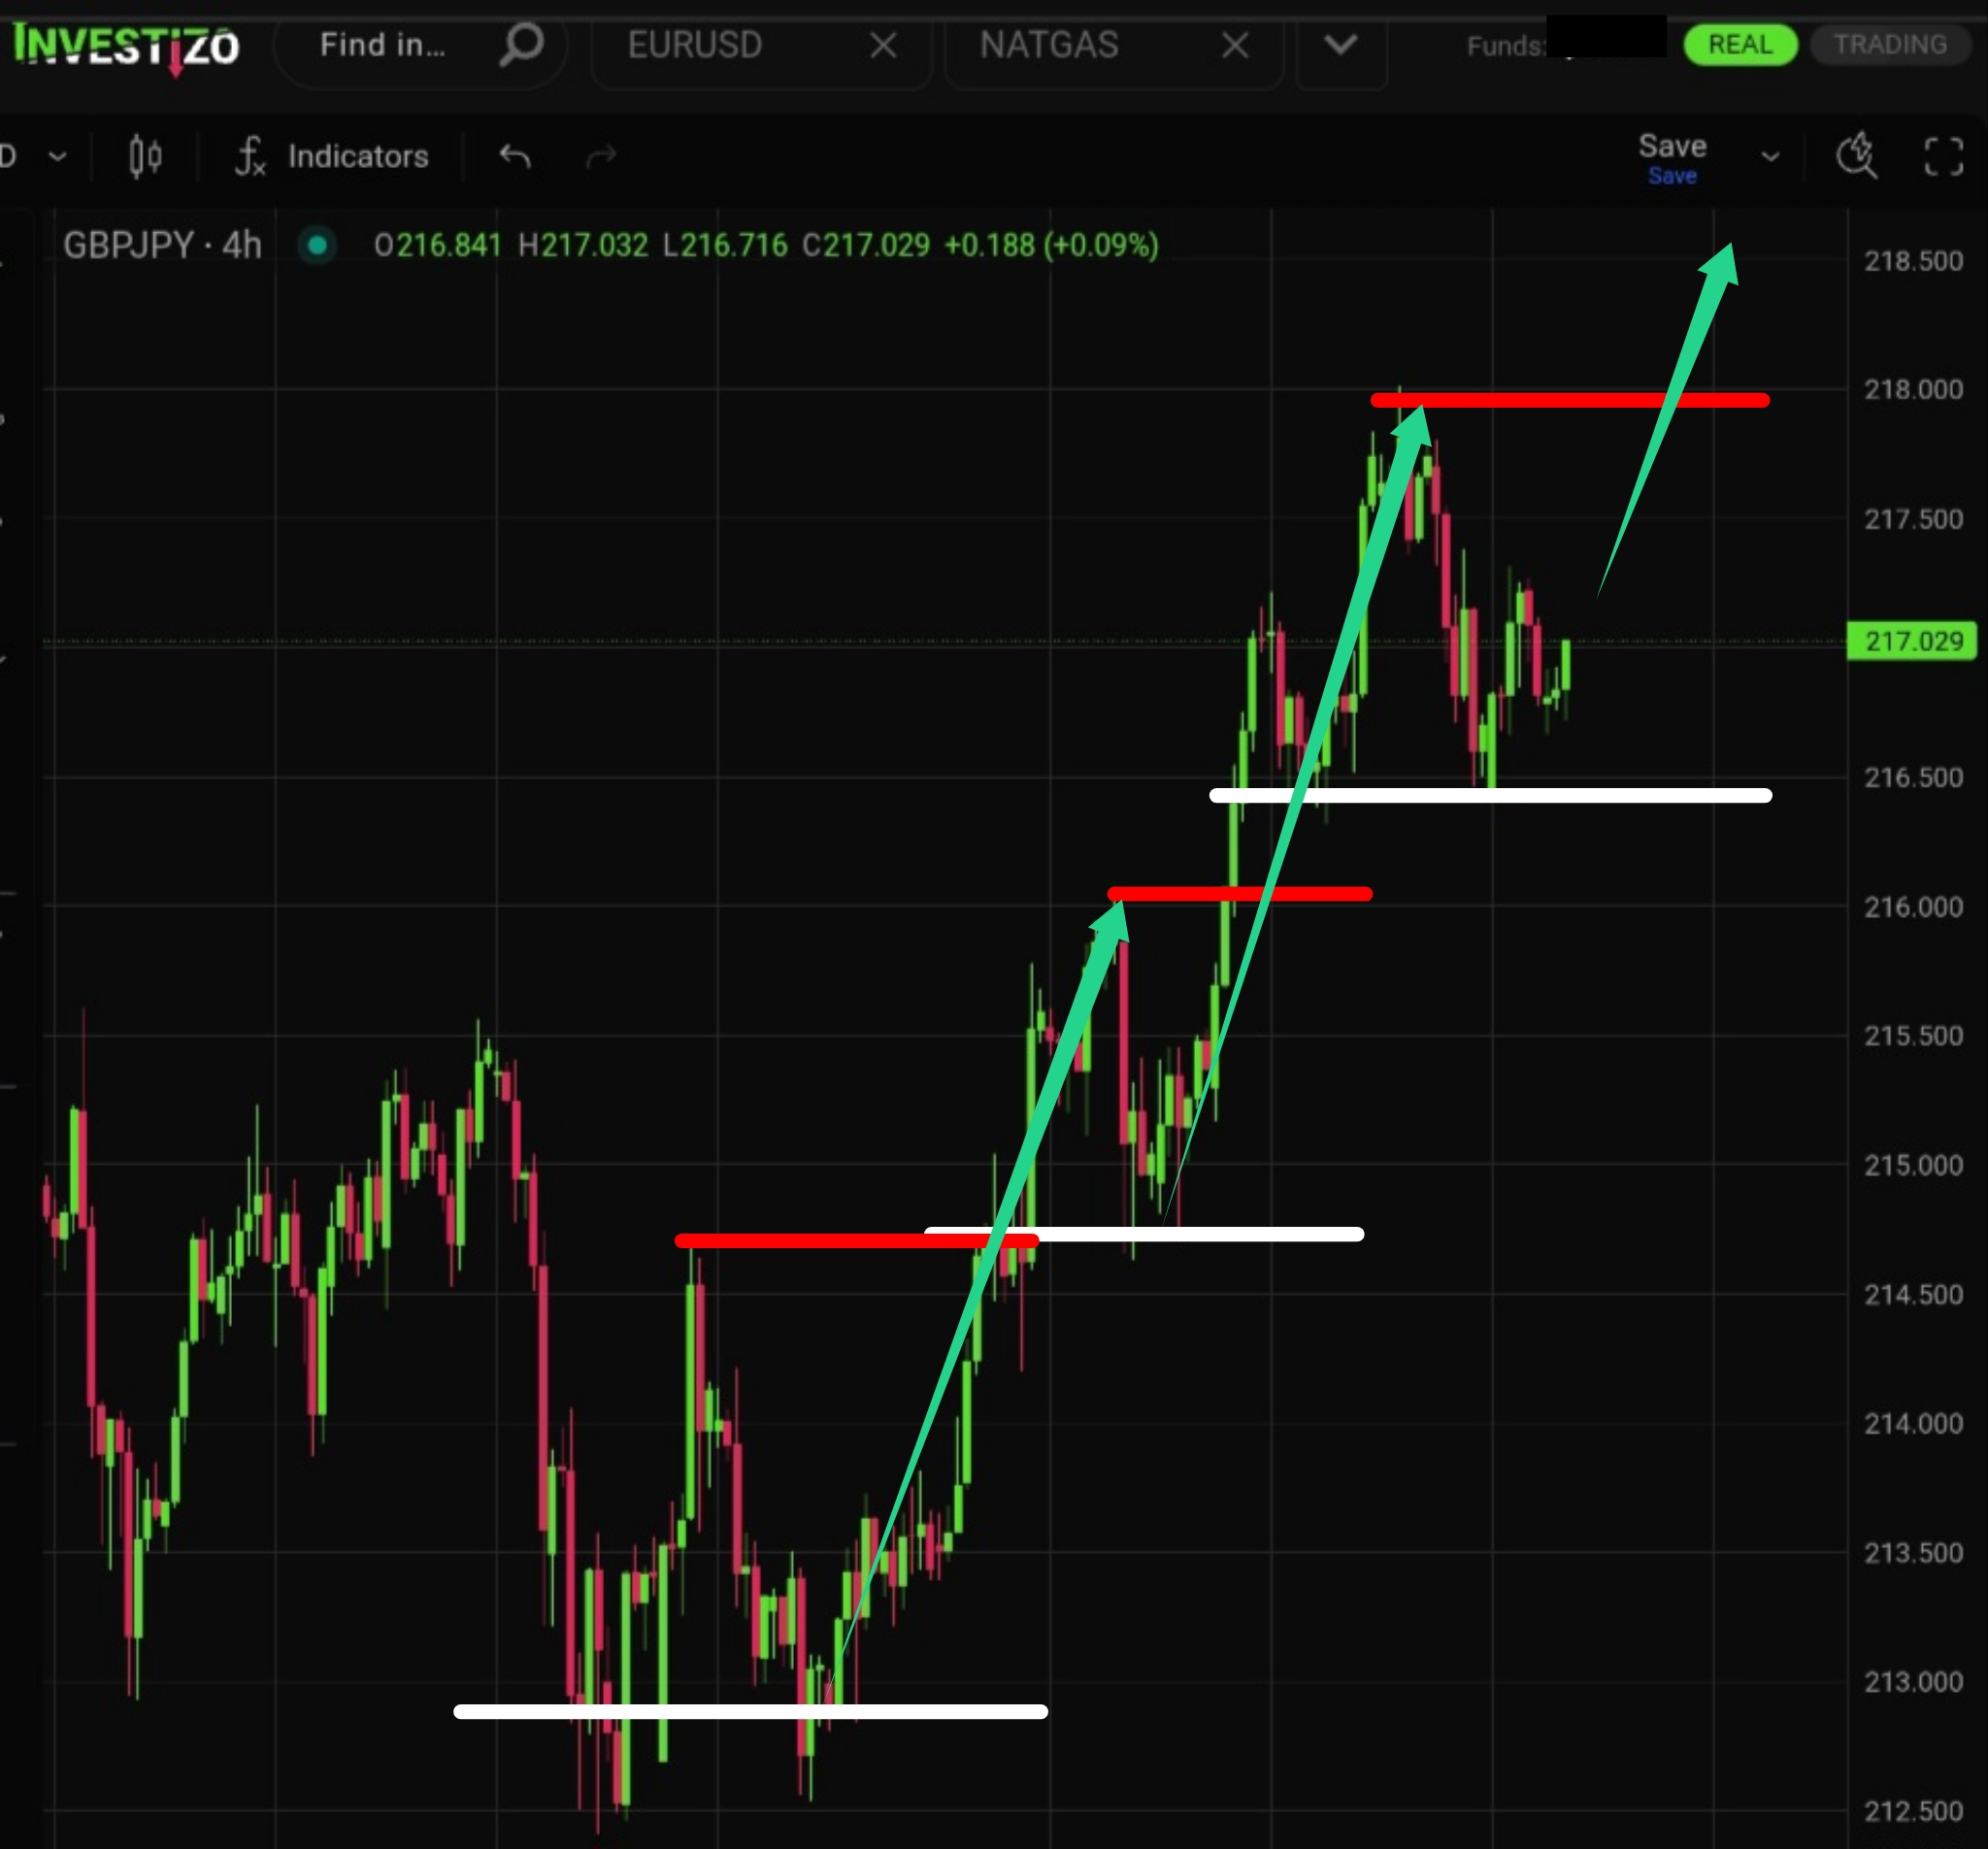
Bulls have successfully defended the overall uptrend structure during the latest technical pullback, effectively removing near-term concerns about a potential trend reversal.
From a medium-term perspective, the pair continues to exhibit clear bearish dominance.
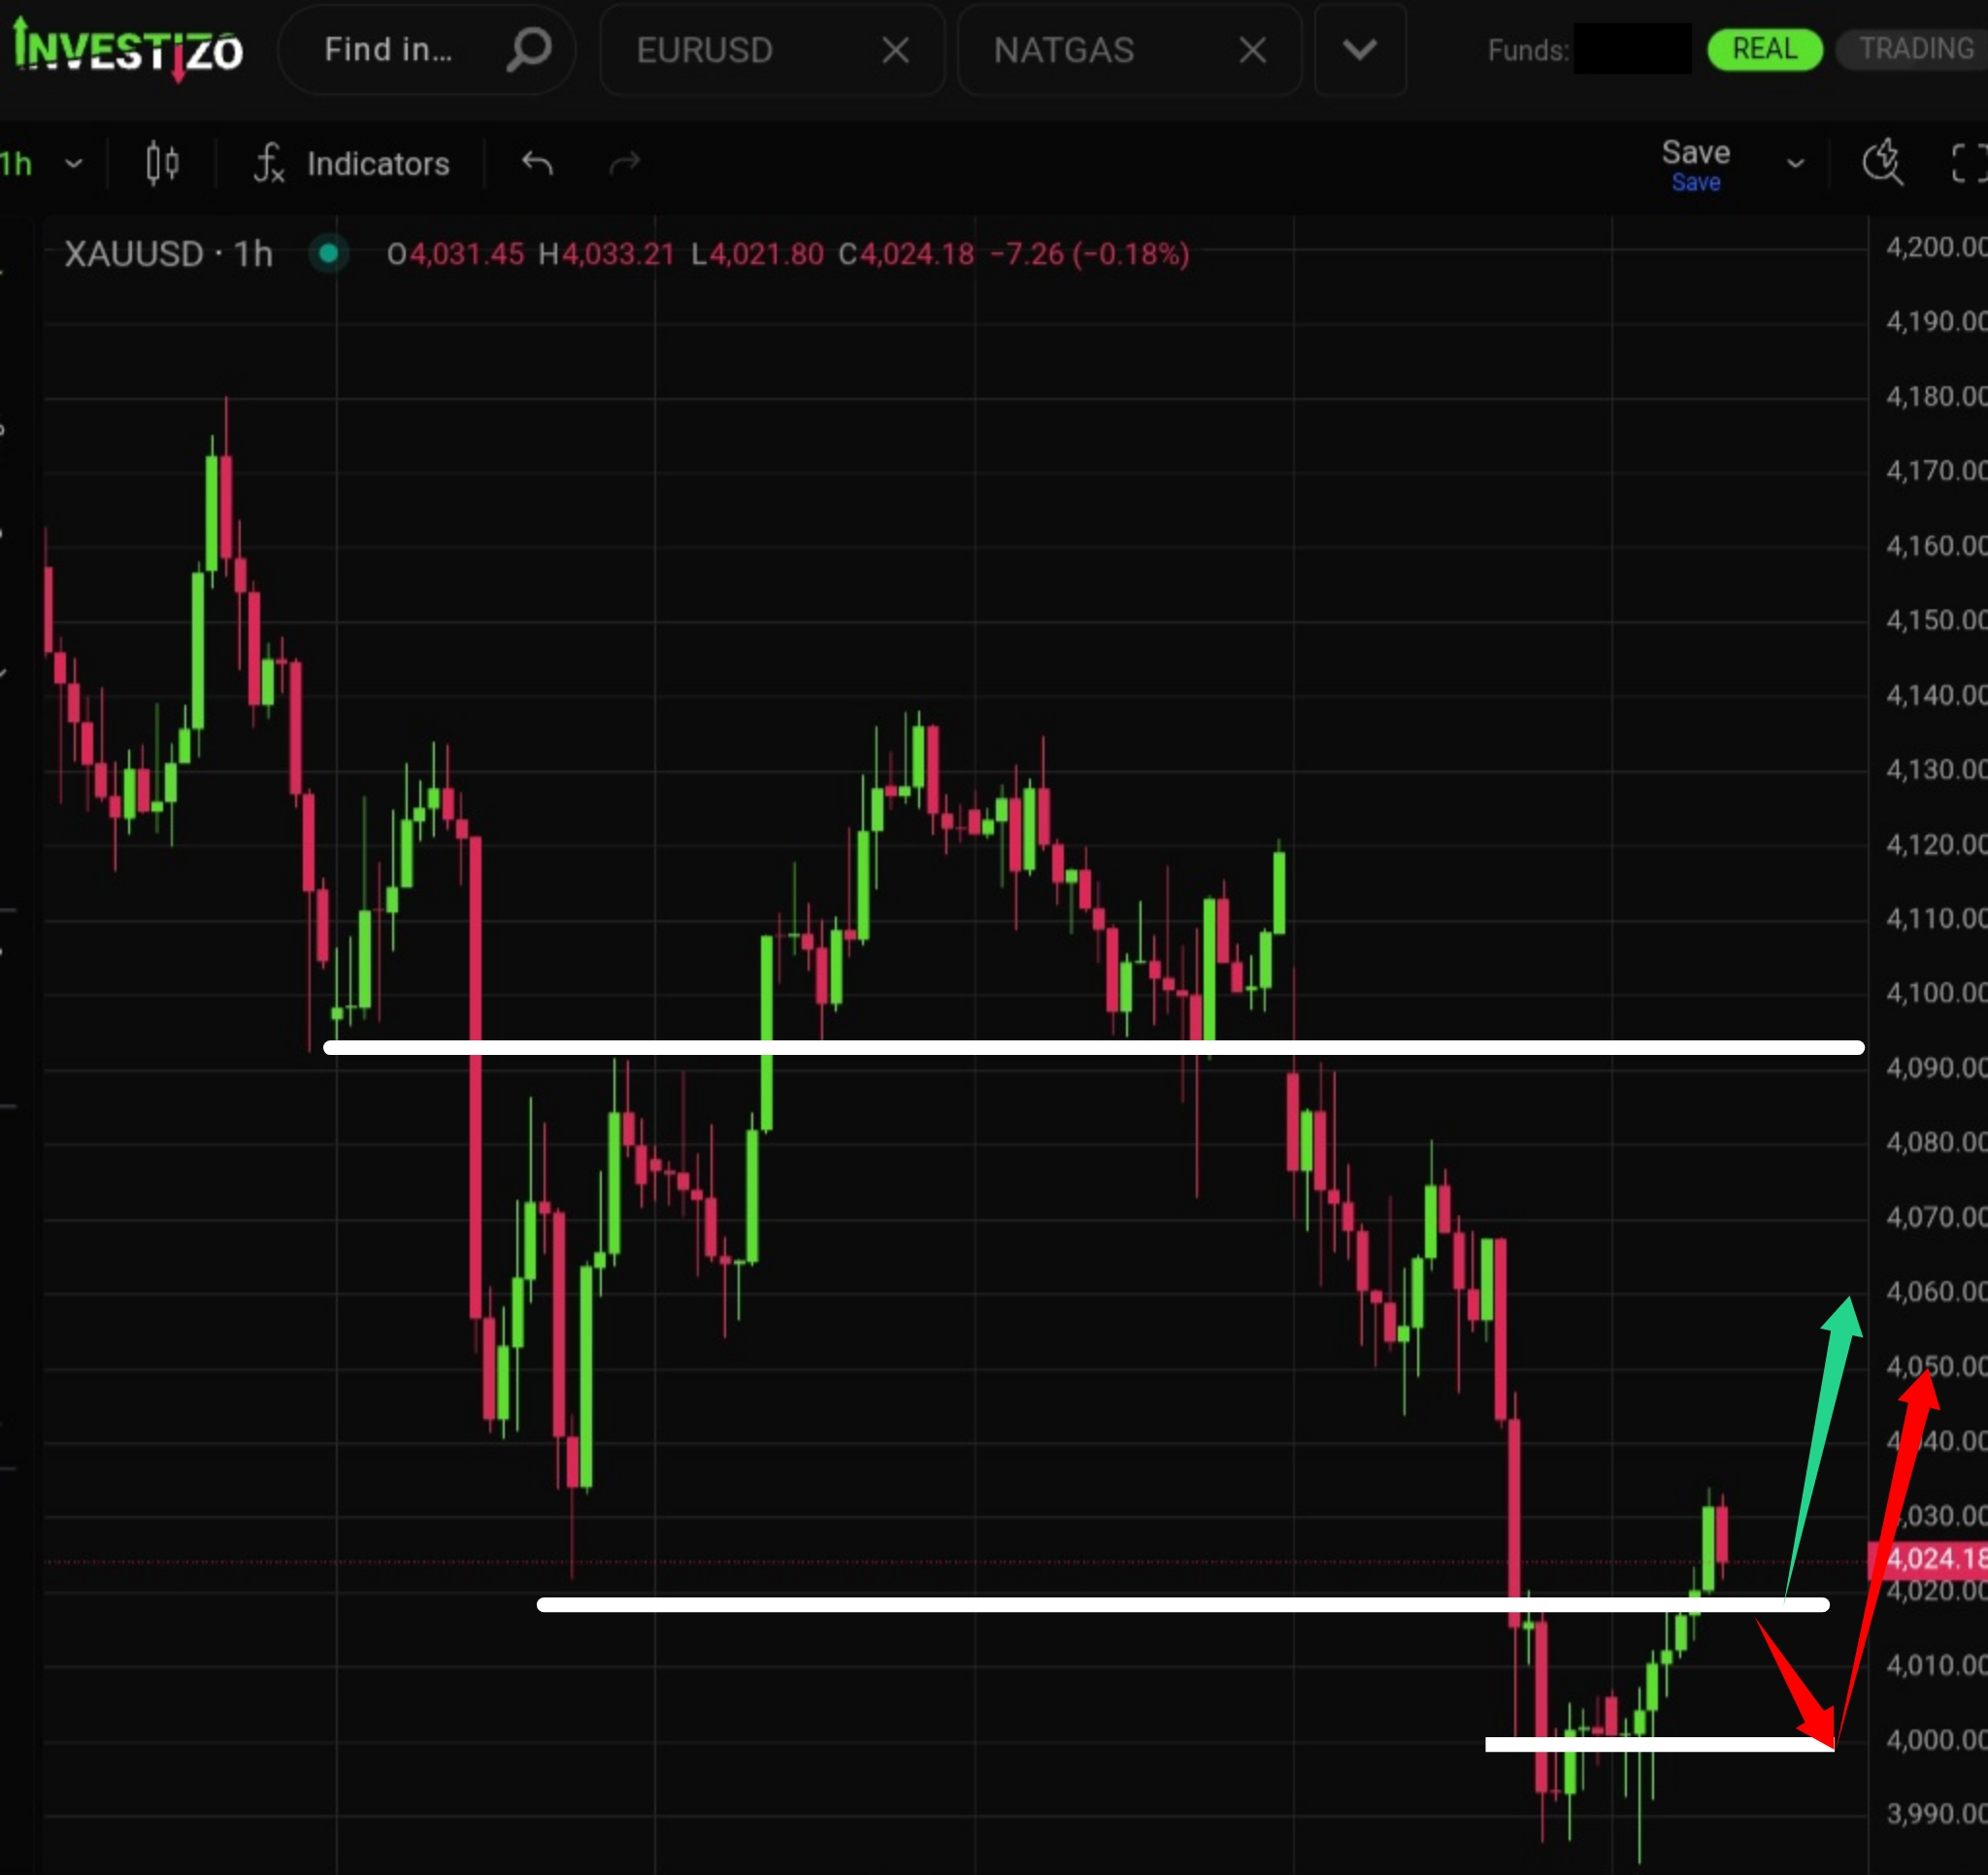
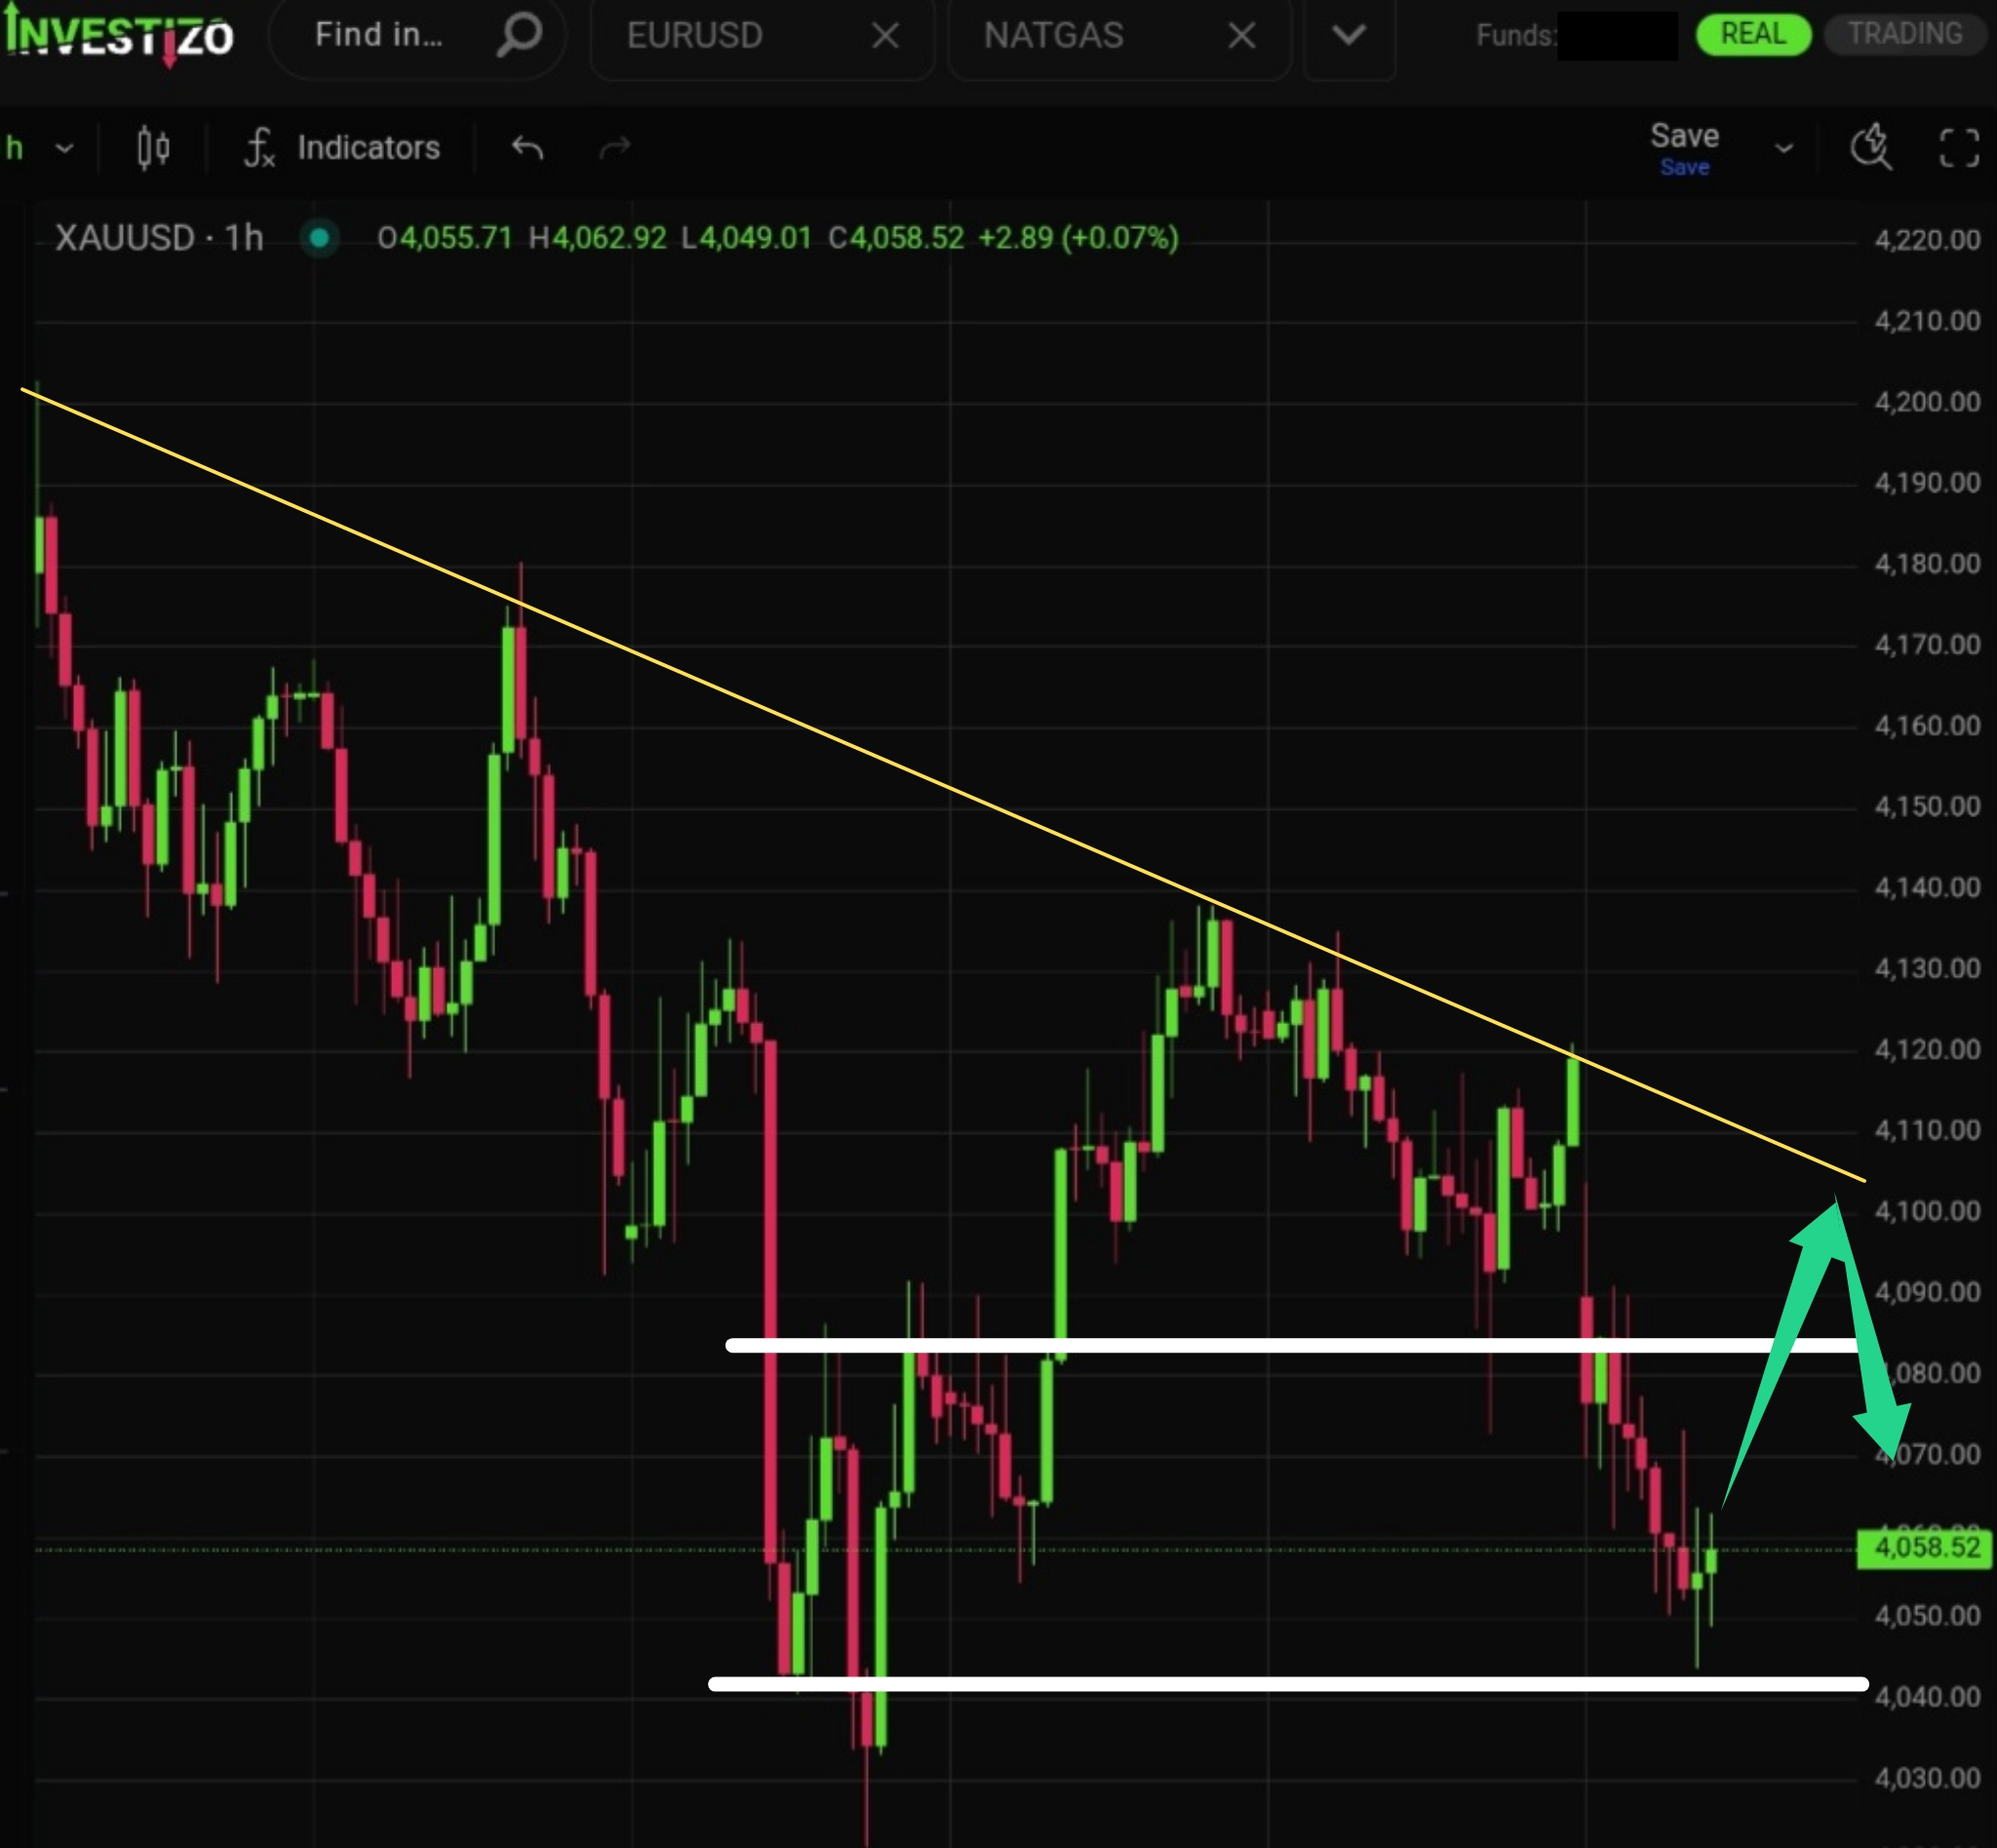
Gold dipped below the key psychological level of $4,000 per troy ounce but buyers are currently treating this zone as fair value and are actively defending it.
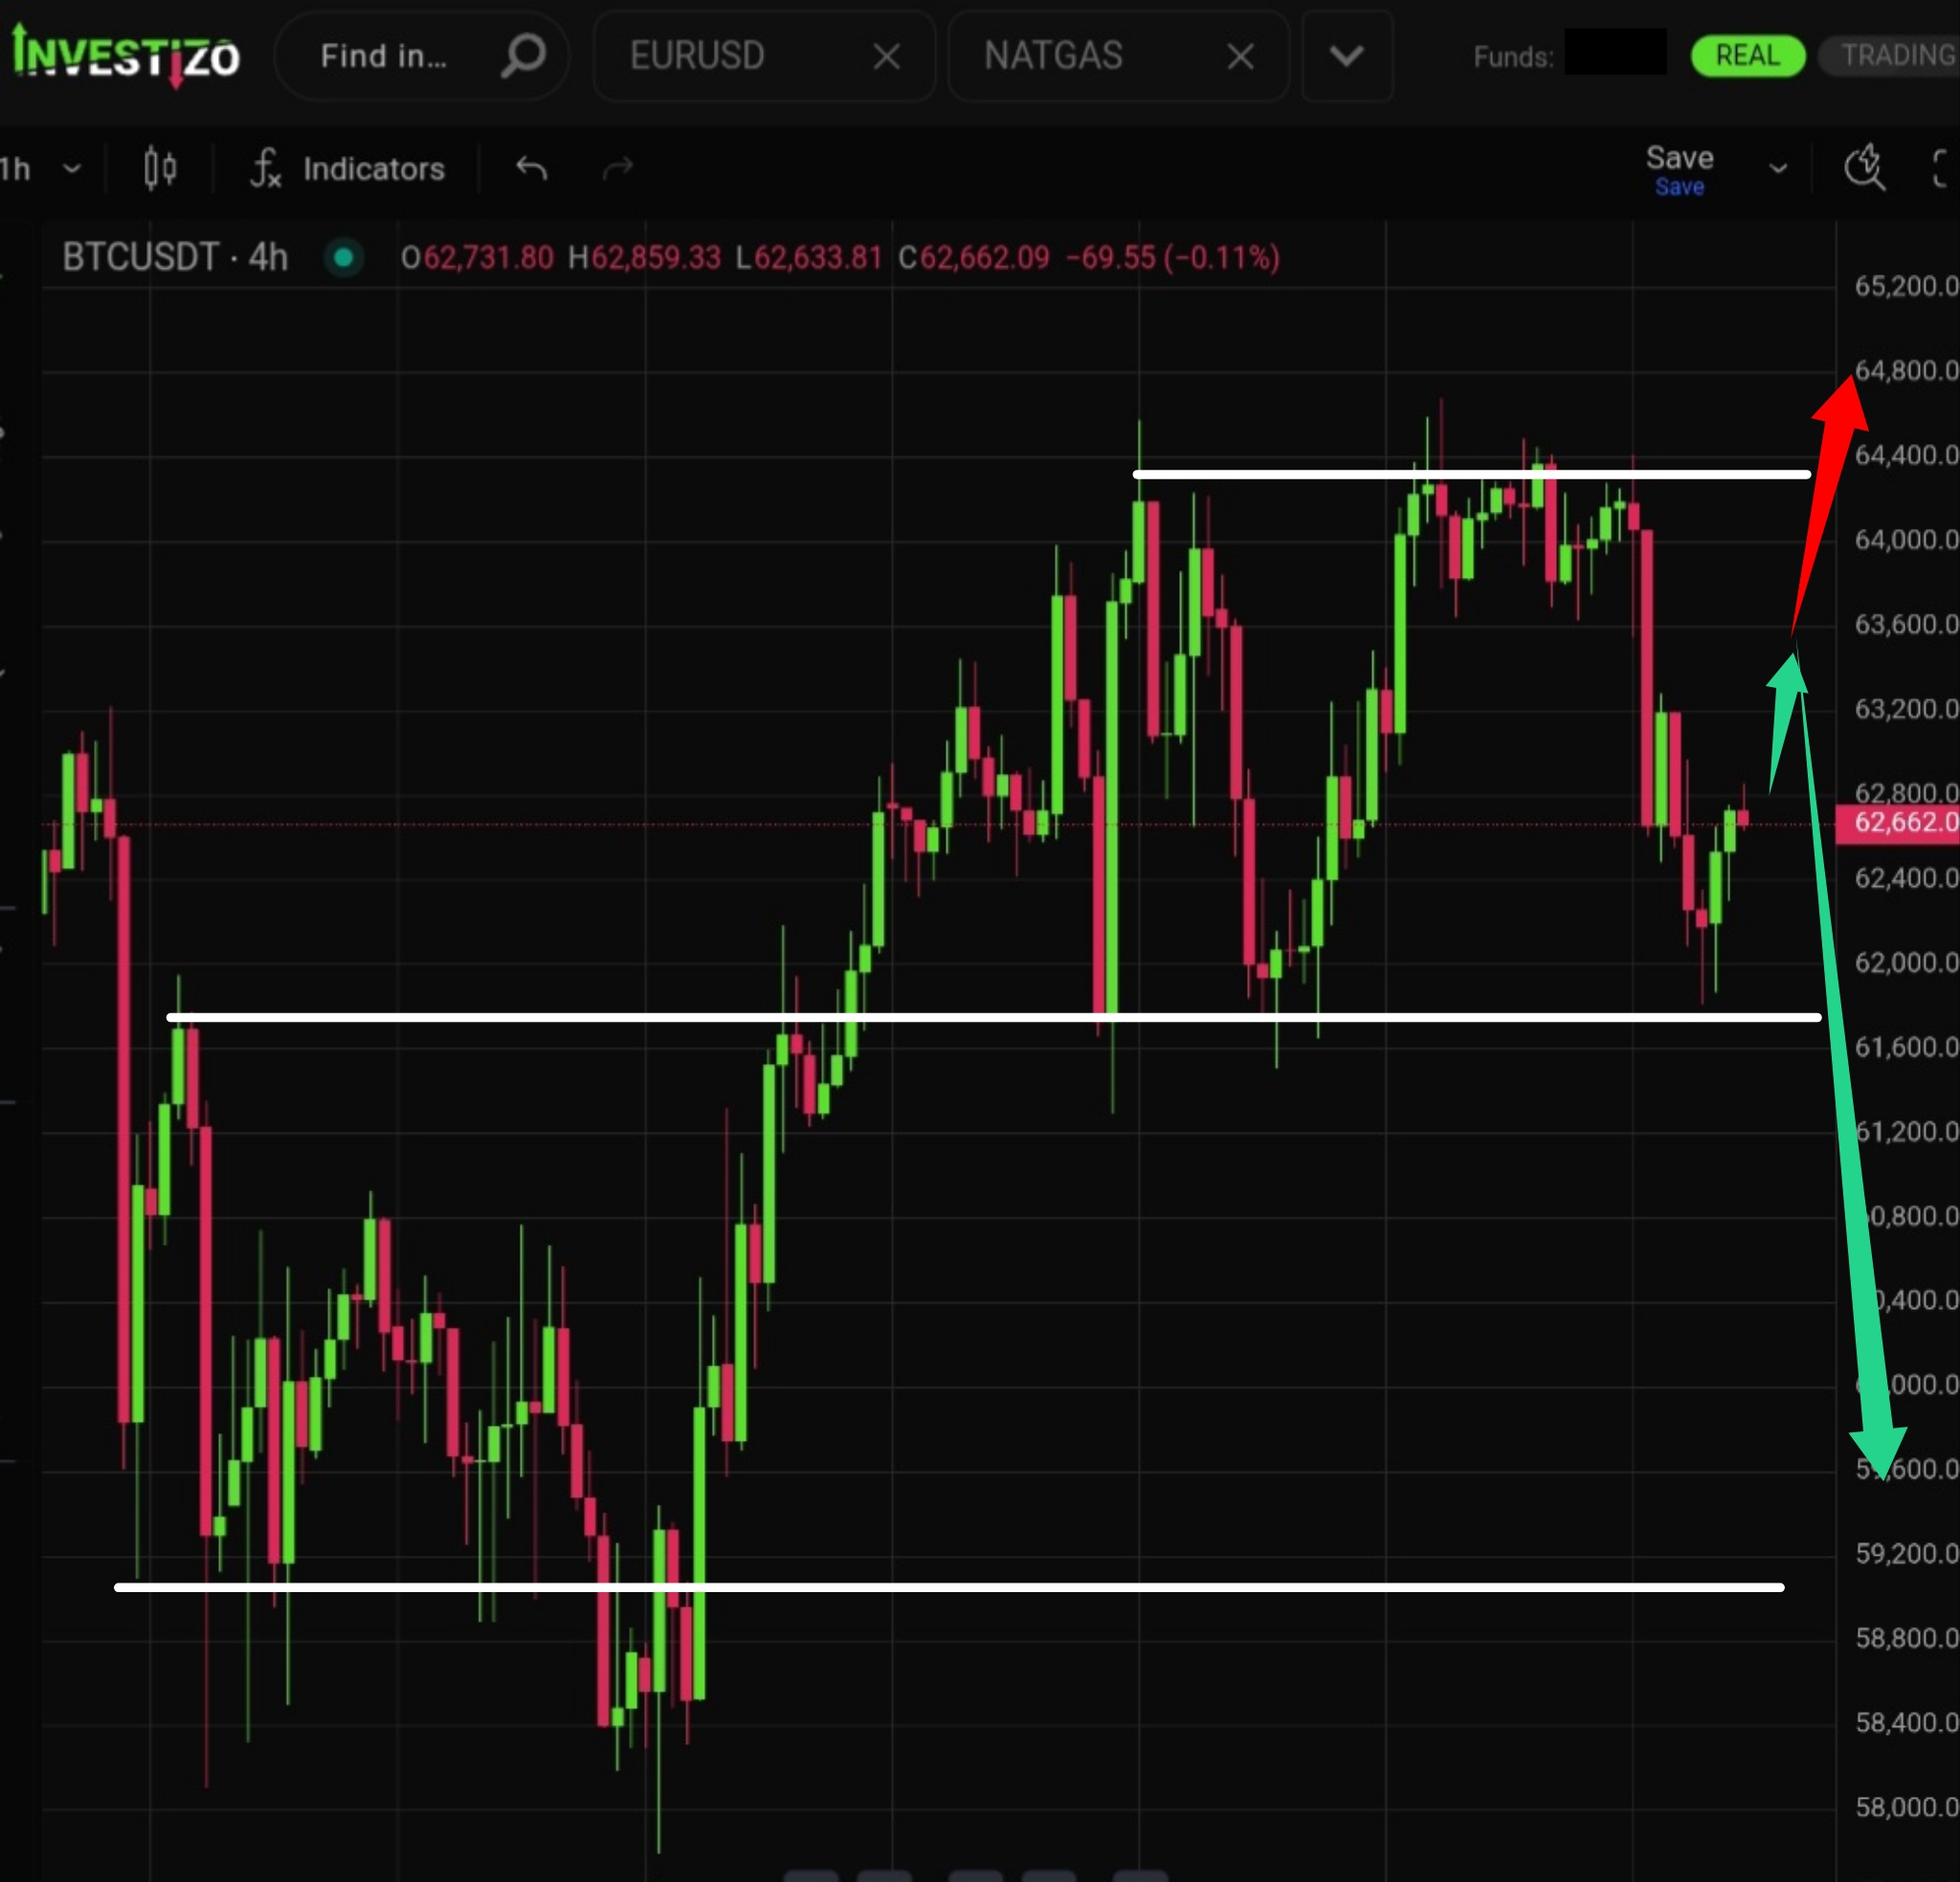
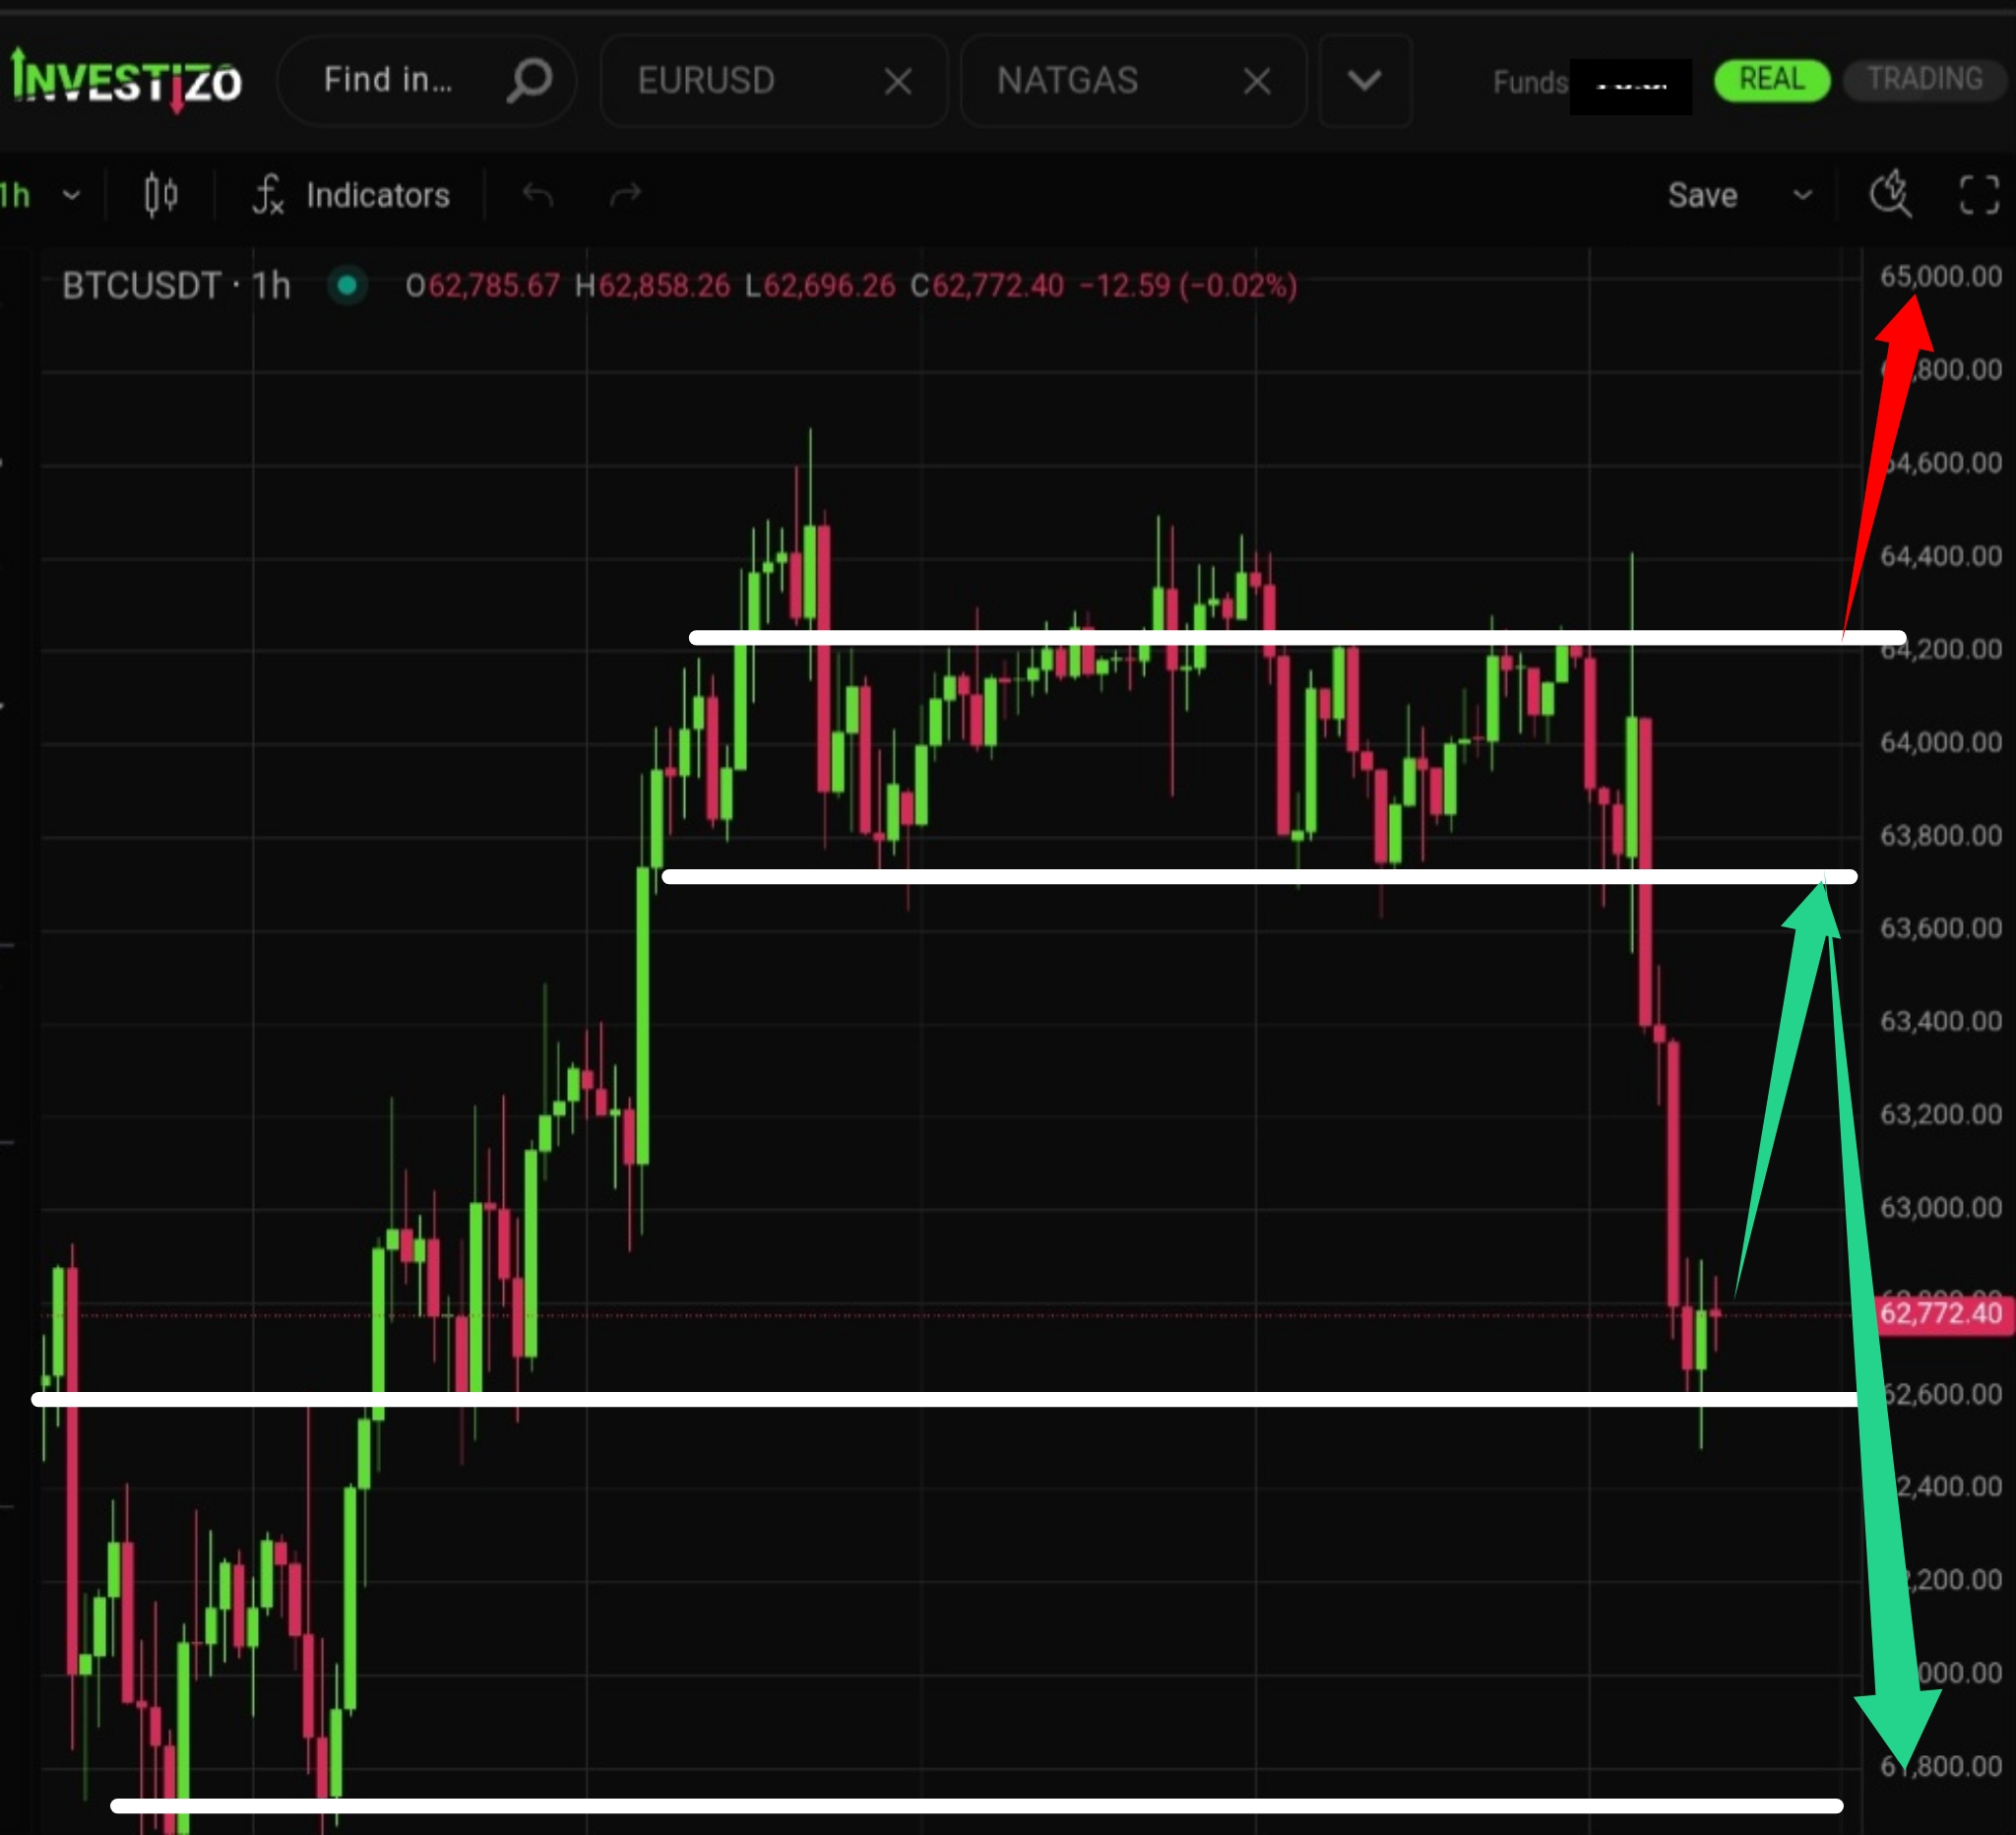
Bitcoin (BTC/USD) trades at 62,660 this Tuesday morning, remaining tightly bound within a risk-off macro corridor.
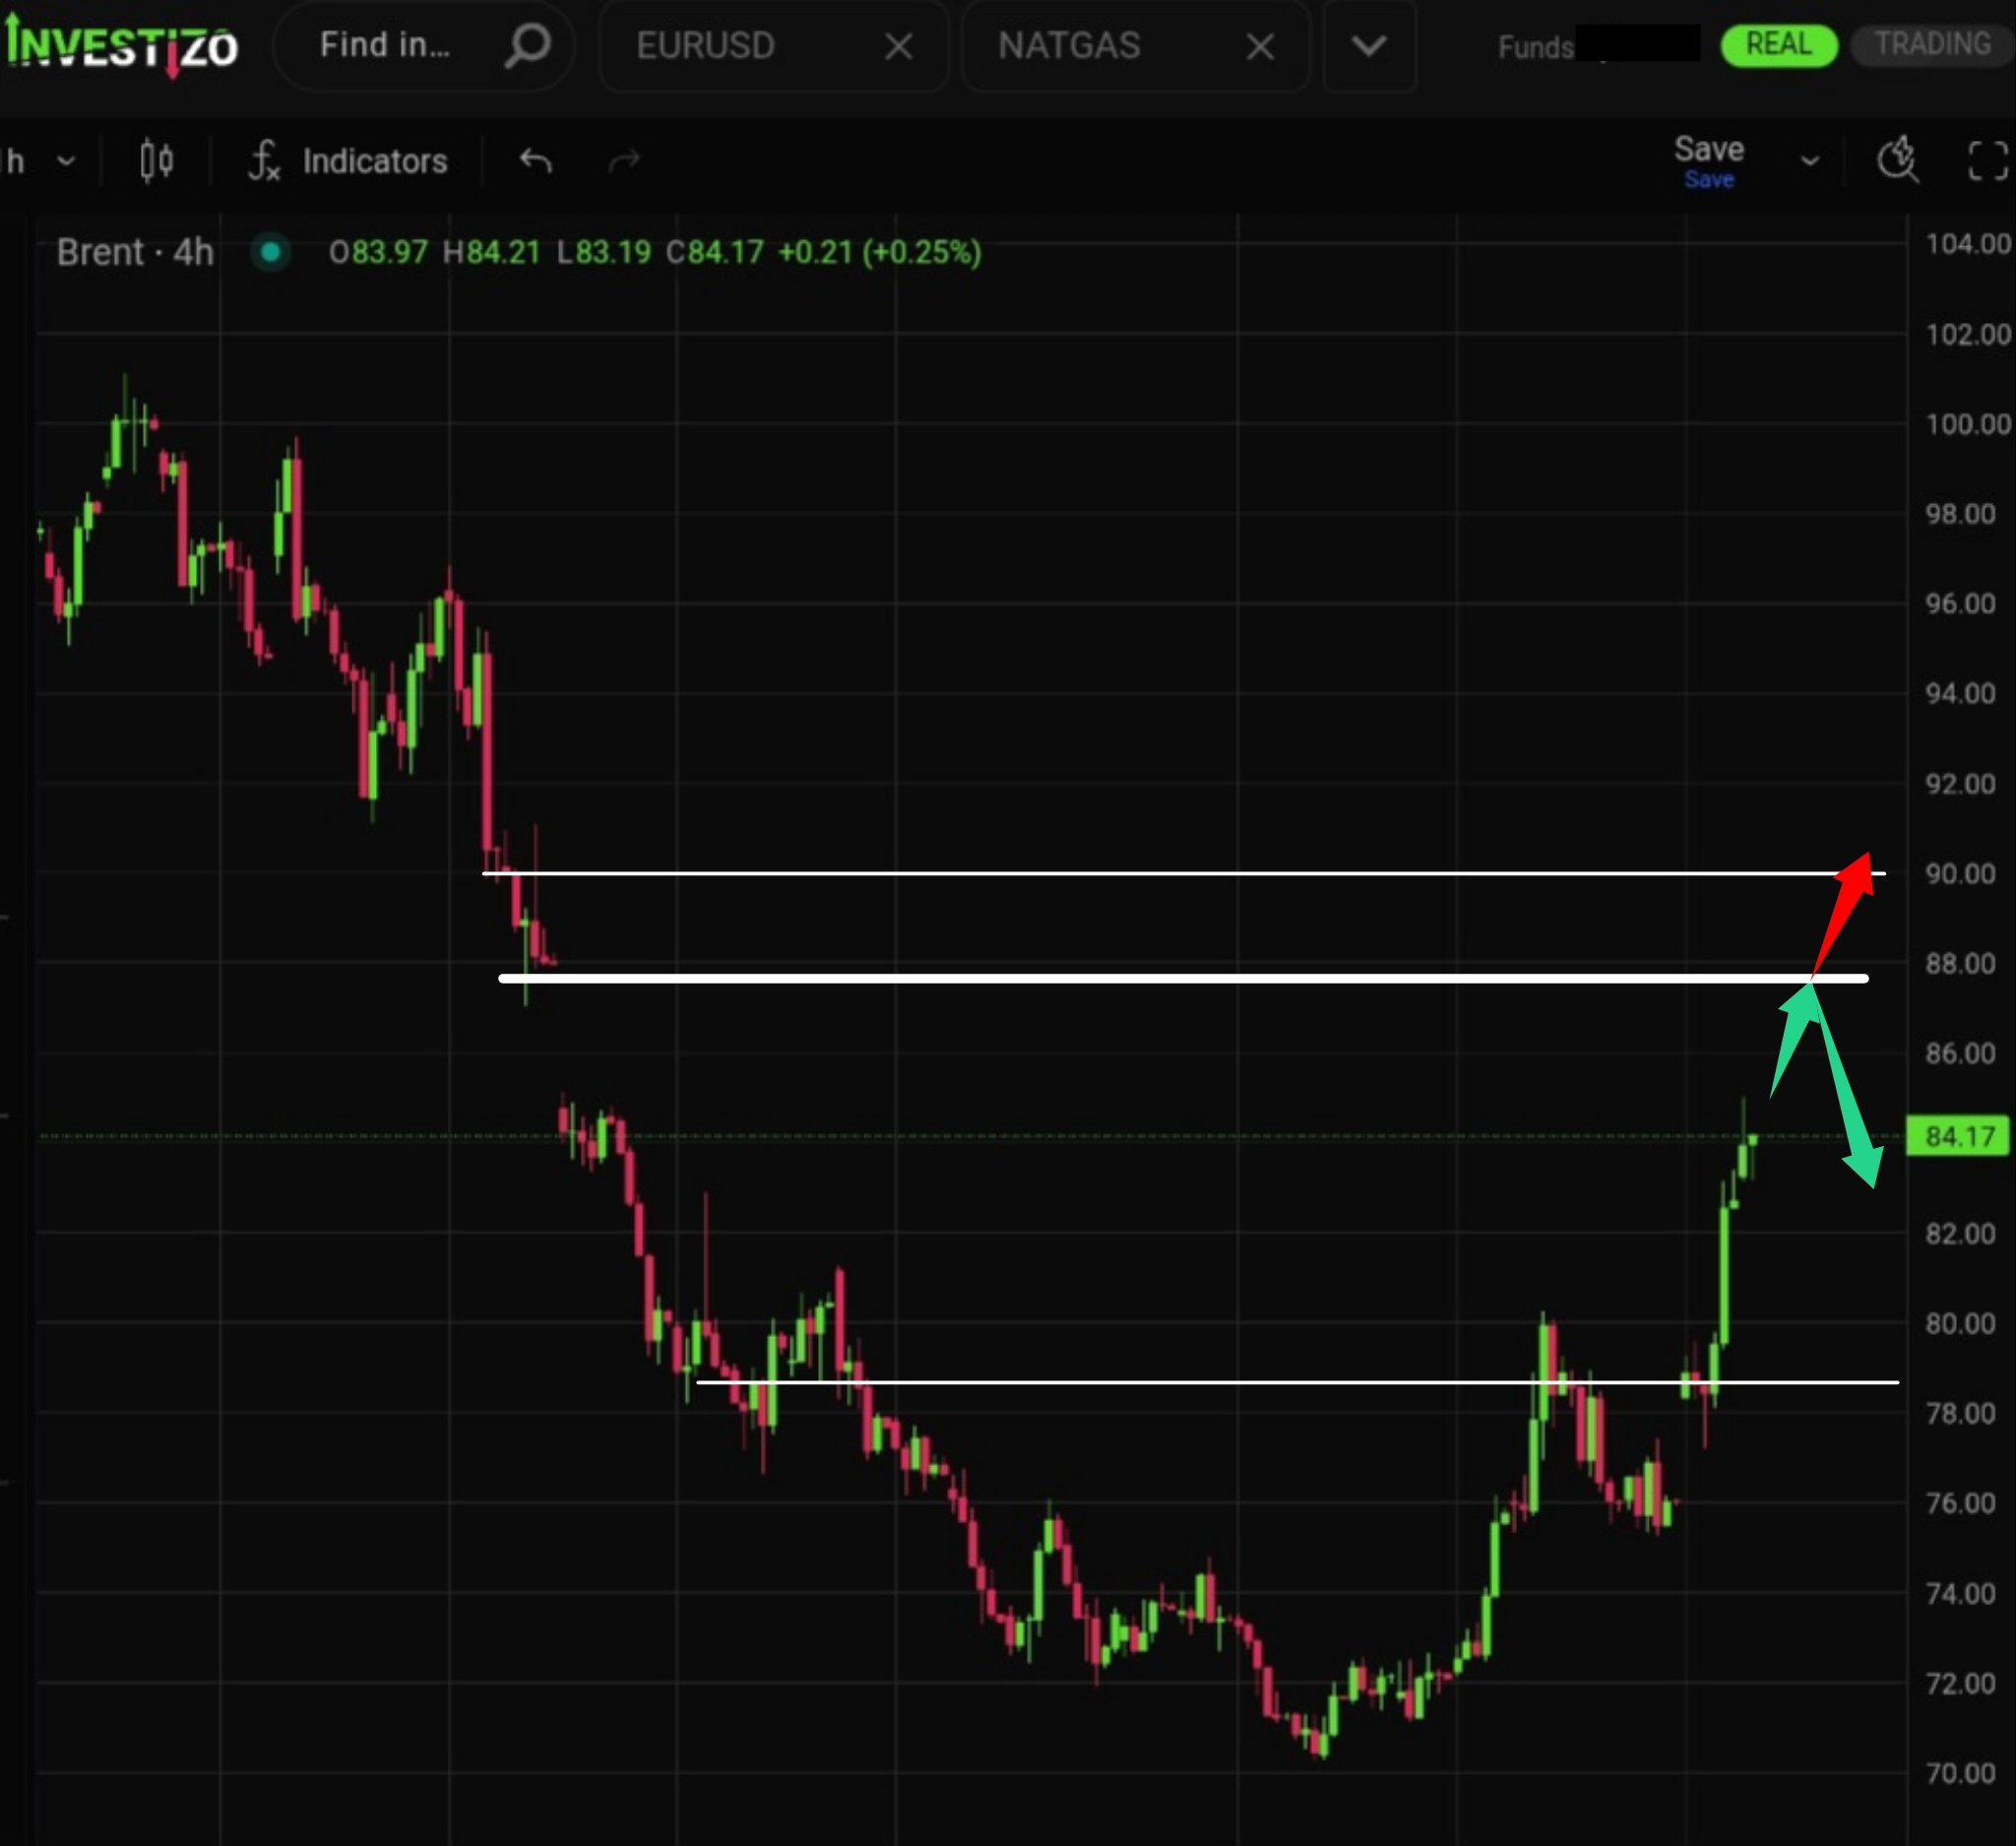
Brent Crude has exploded to 84.17 this Tuesday morning, gaining nearly 10% in a vertical rally that is rapidly closing in on a key technical chart gap at 87.00.
Despite the massive and prolonged upward price swing, bulls have so far failed to update the structural high, preserving the overall bearish character of the chart.
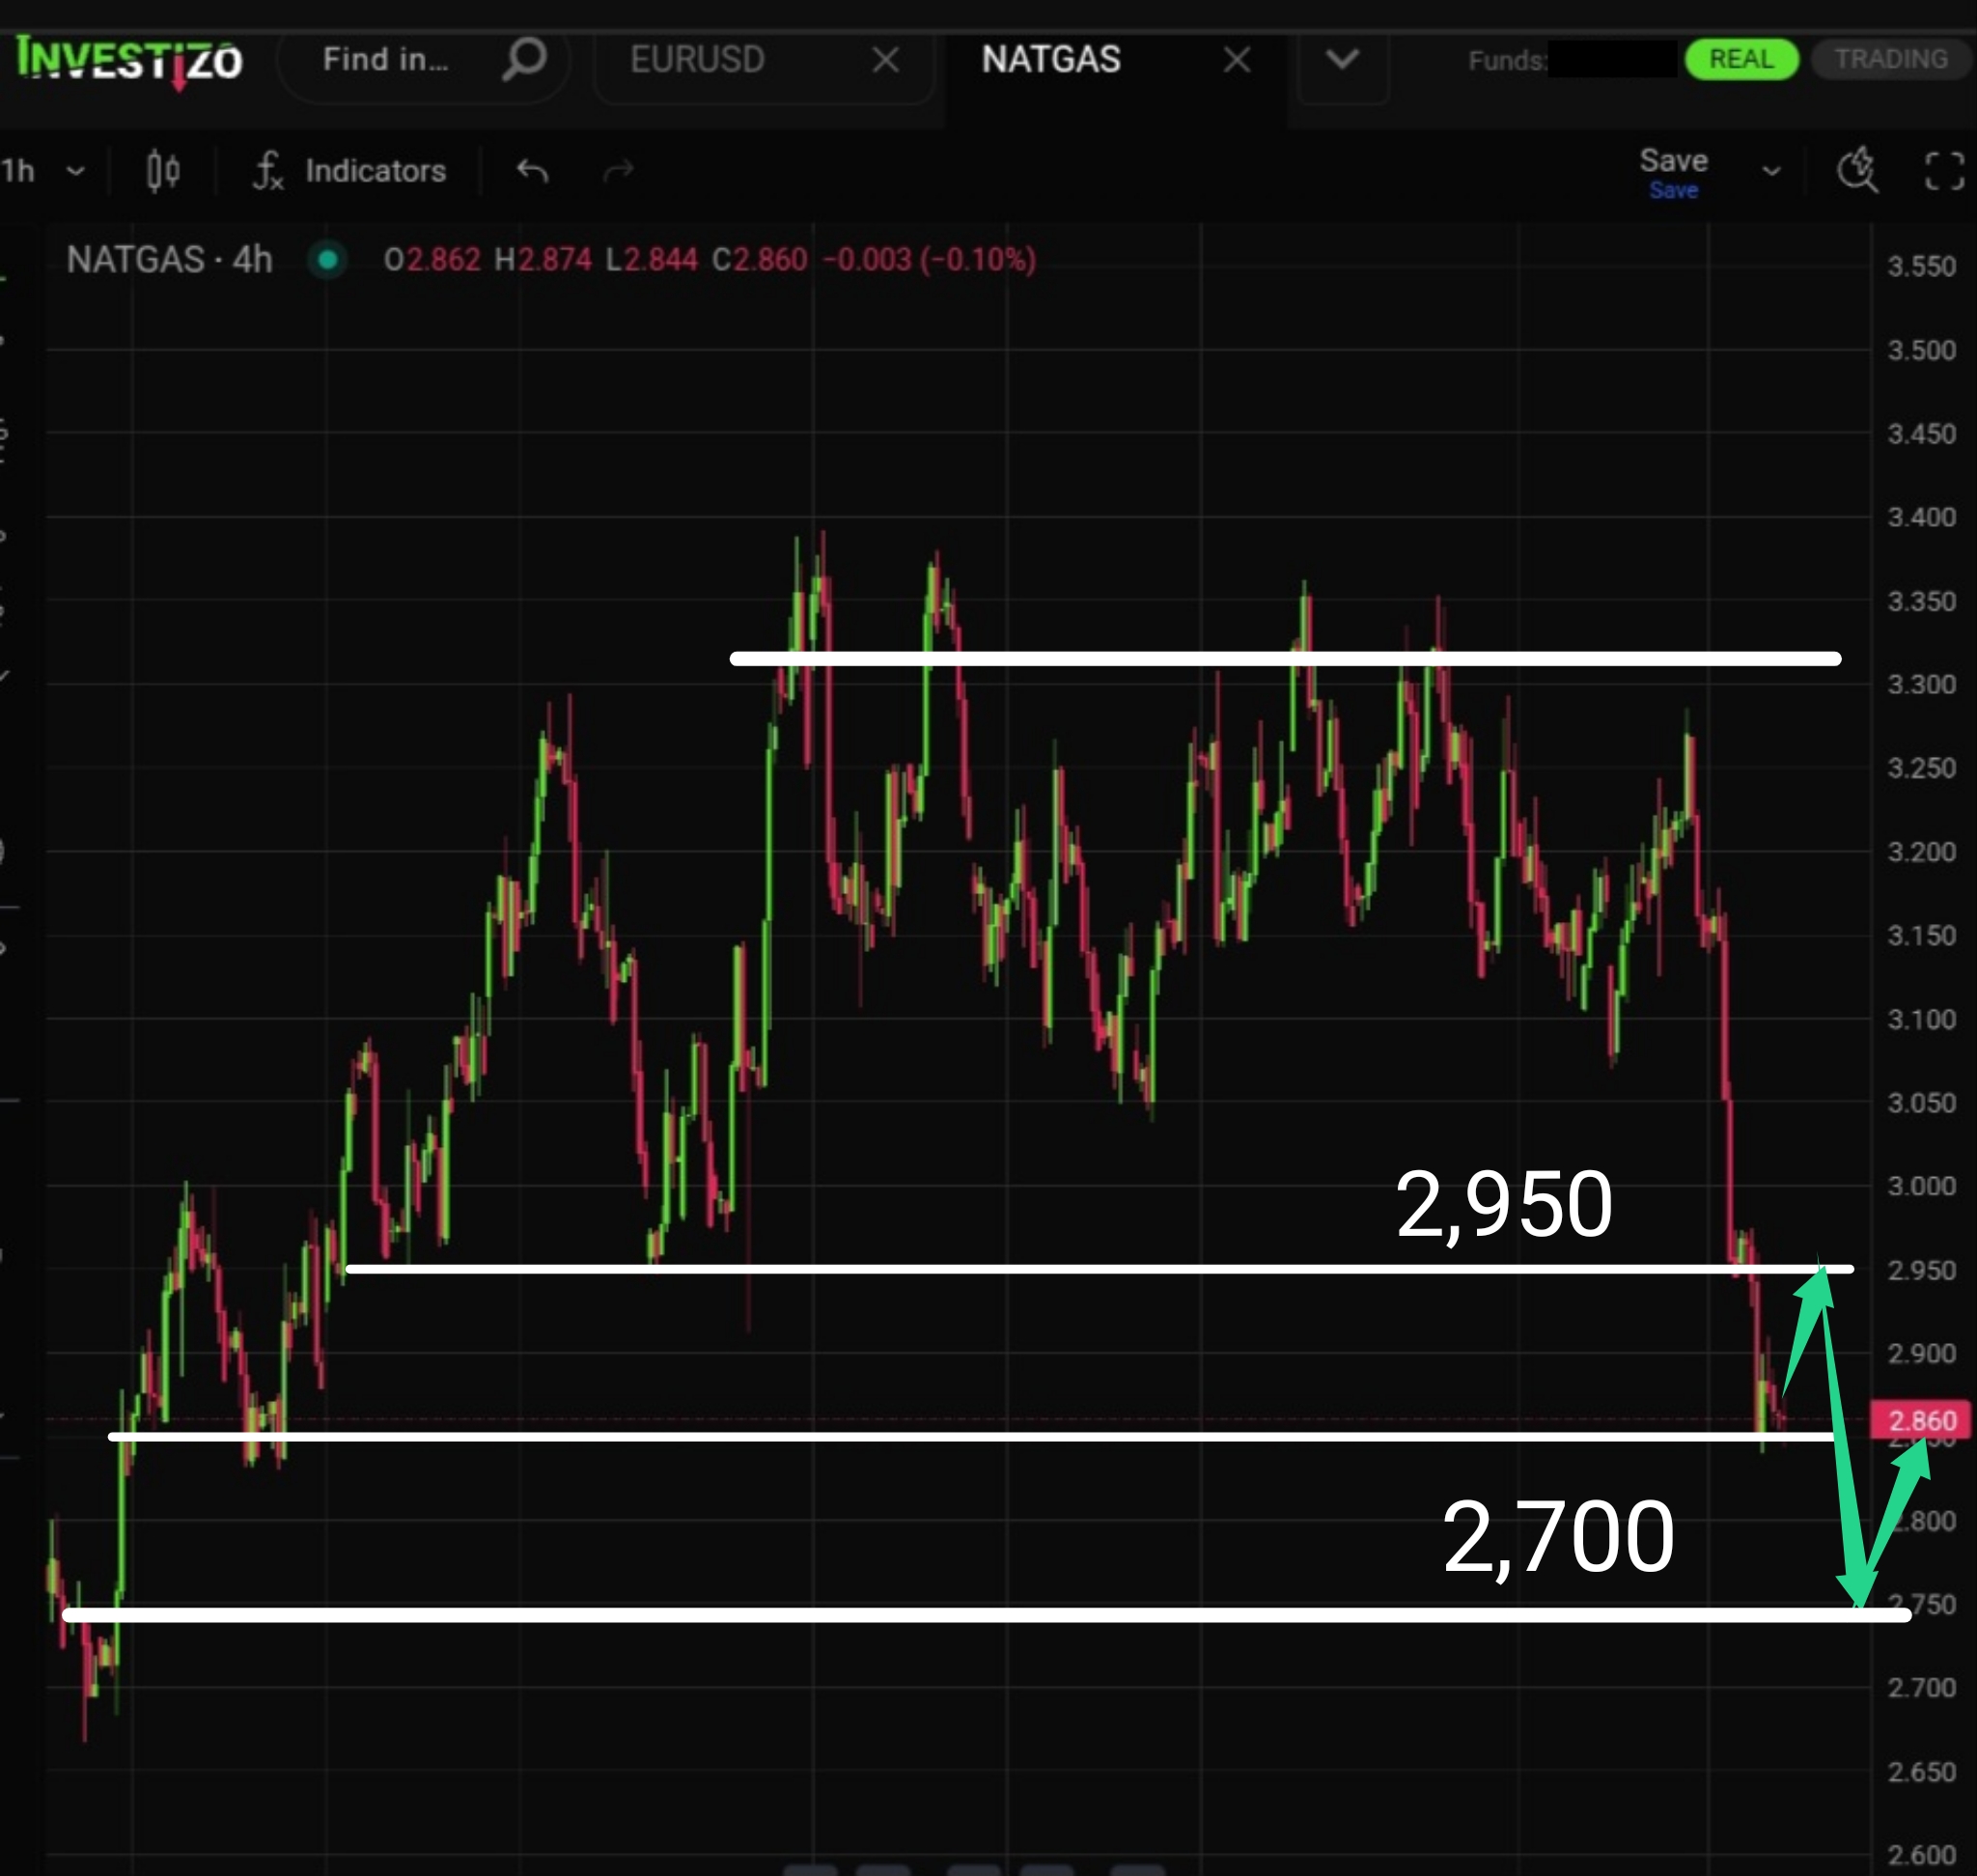
The asset is in the final stage of its downtrend as the market approaches a major support zone around 2,750.
Although the overall downward trend reversal was confirmed last week, the market has chosen a consolidation scenario within a triangle to accumulate momentum before the primary move.
Gold found solid support in the $4,040 zone, which could enable bulls to make another attempt at challenging the descending trendline near $4,100.
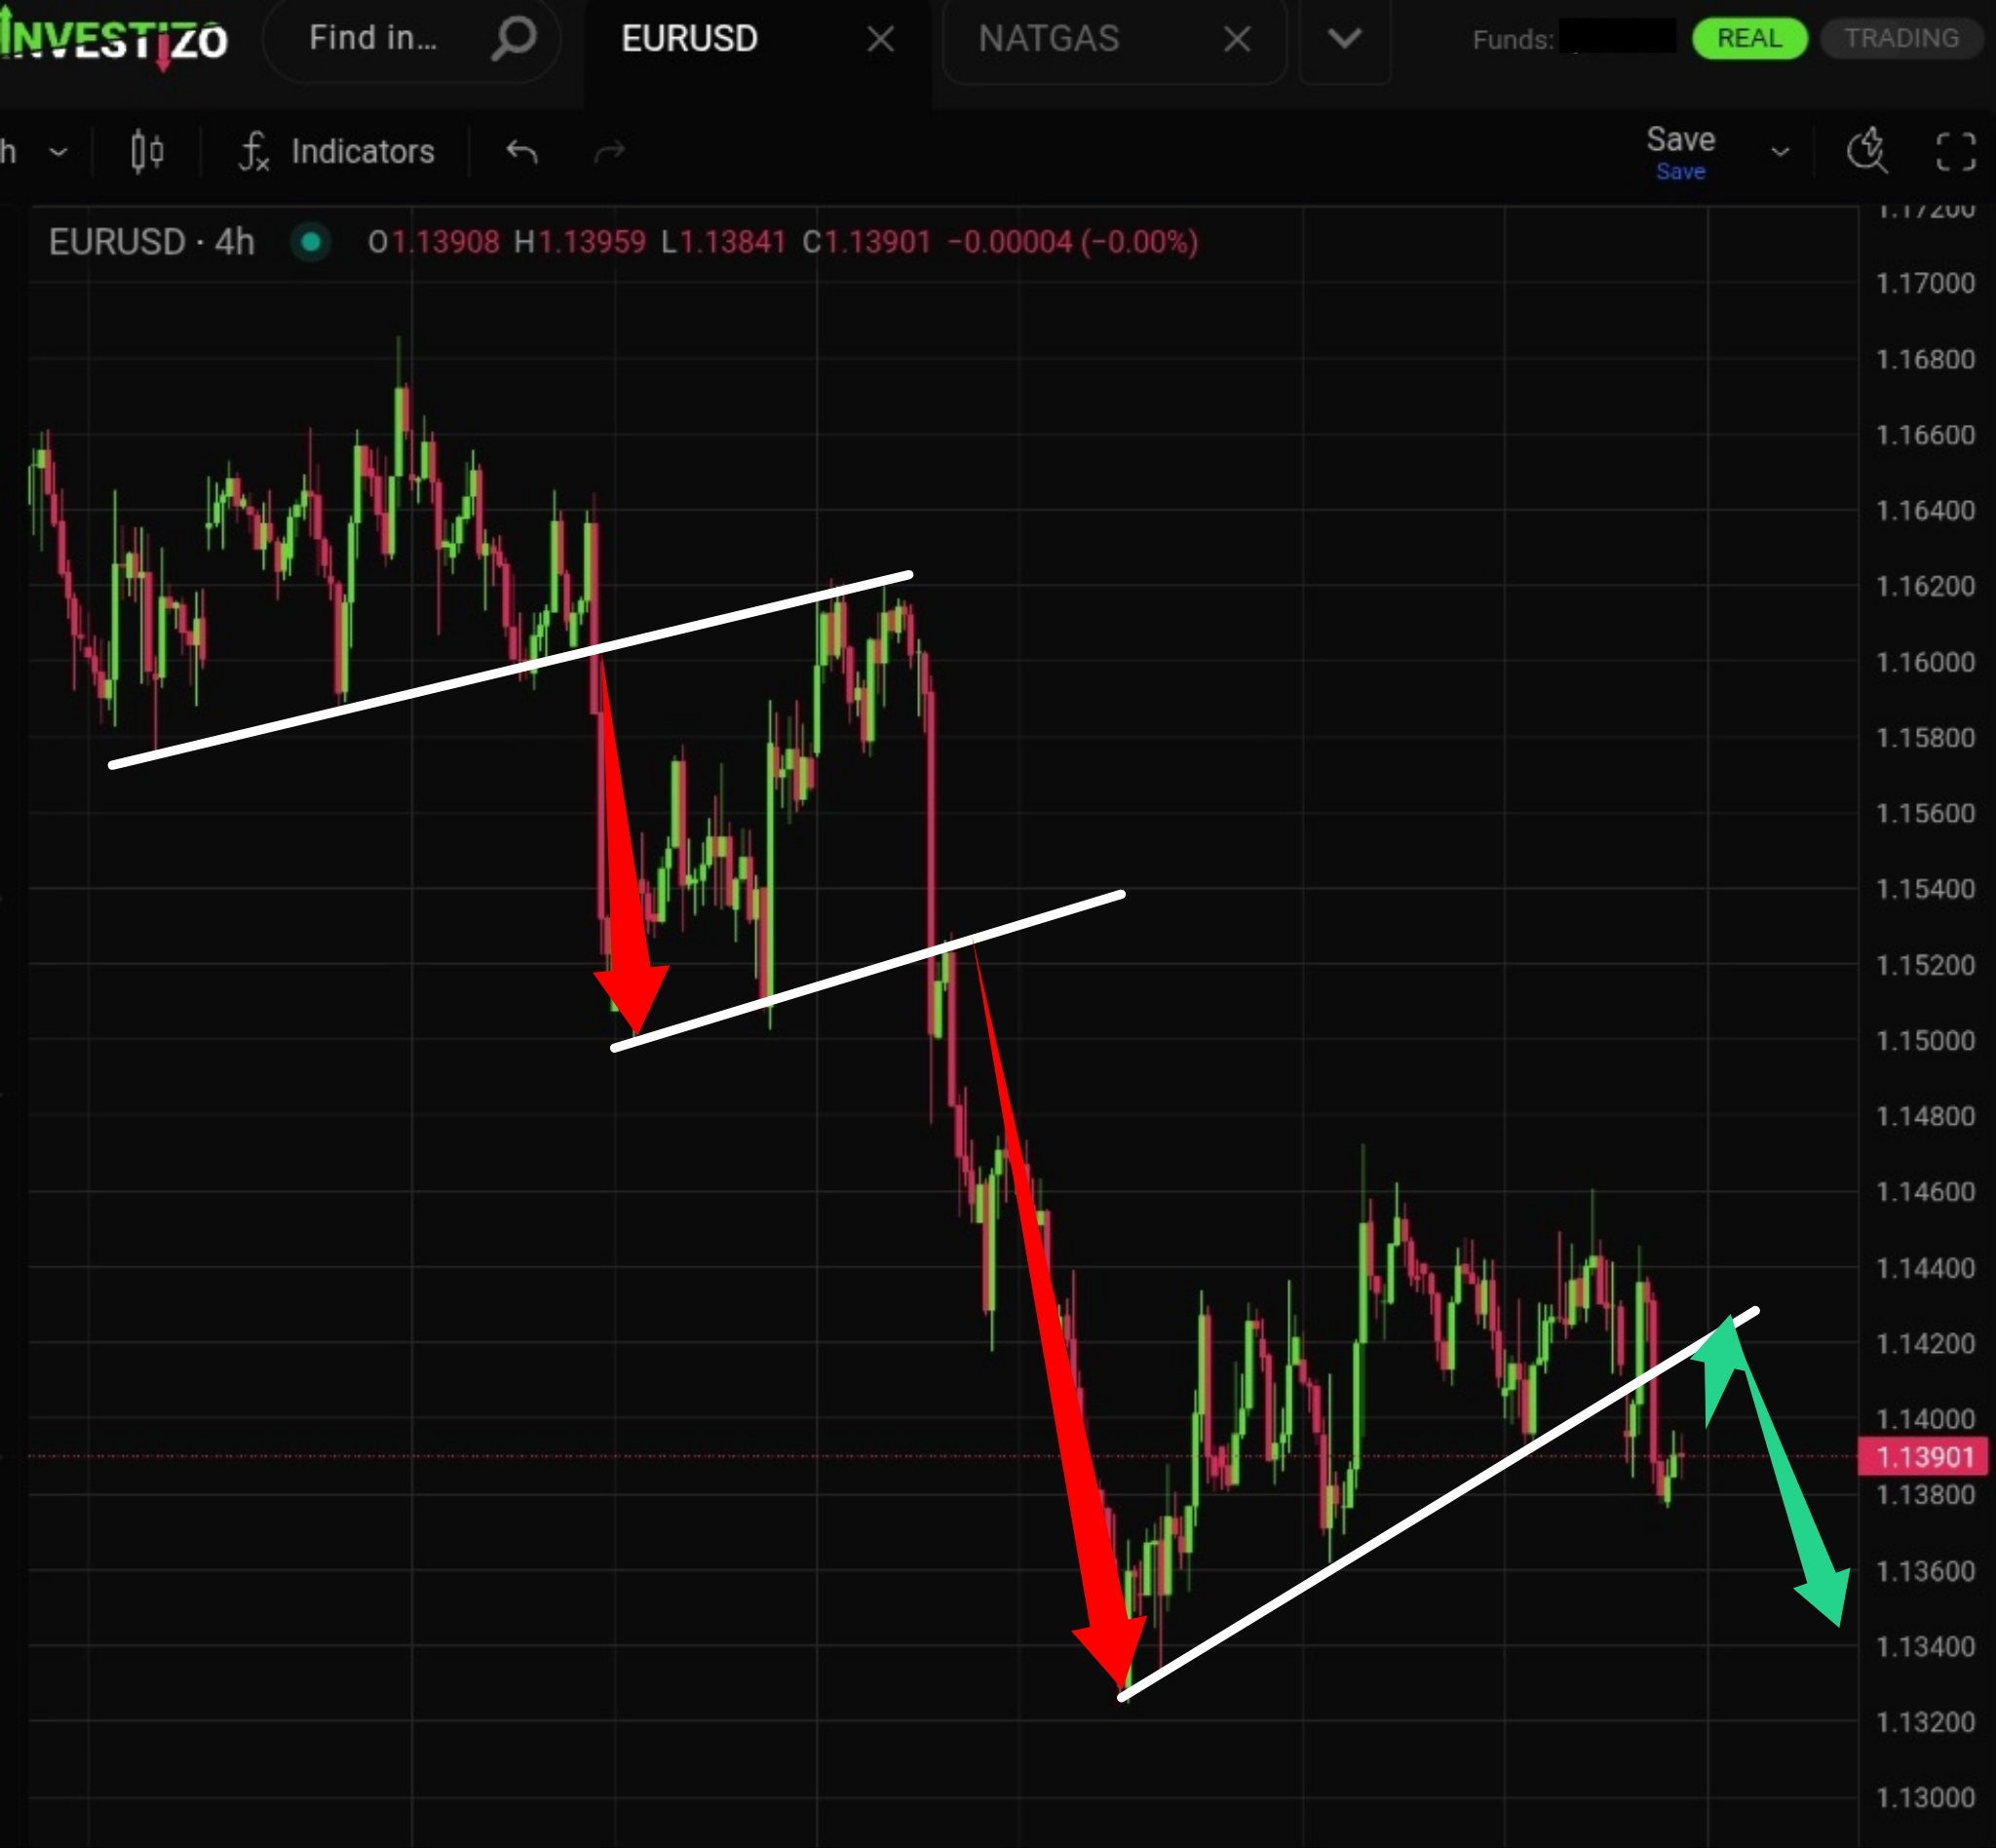
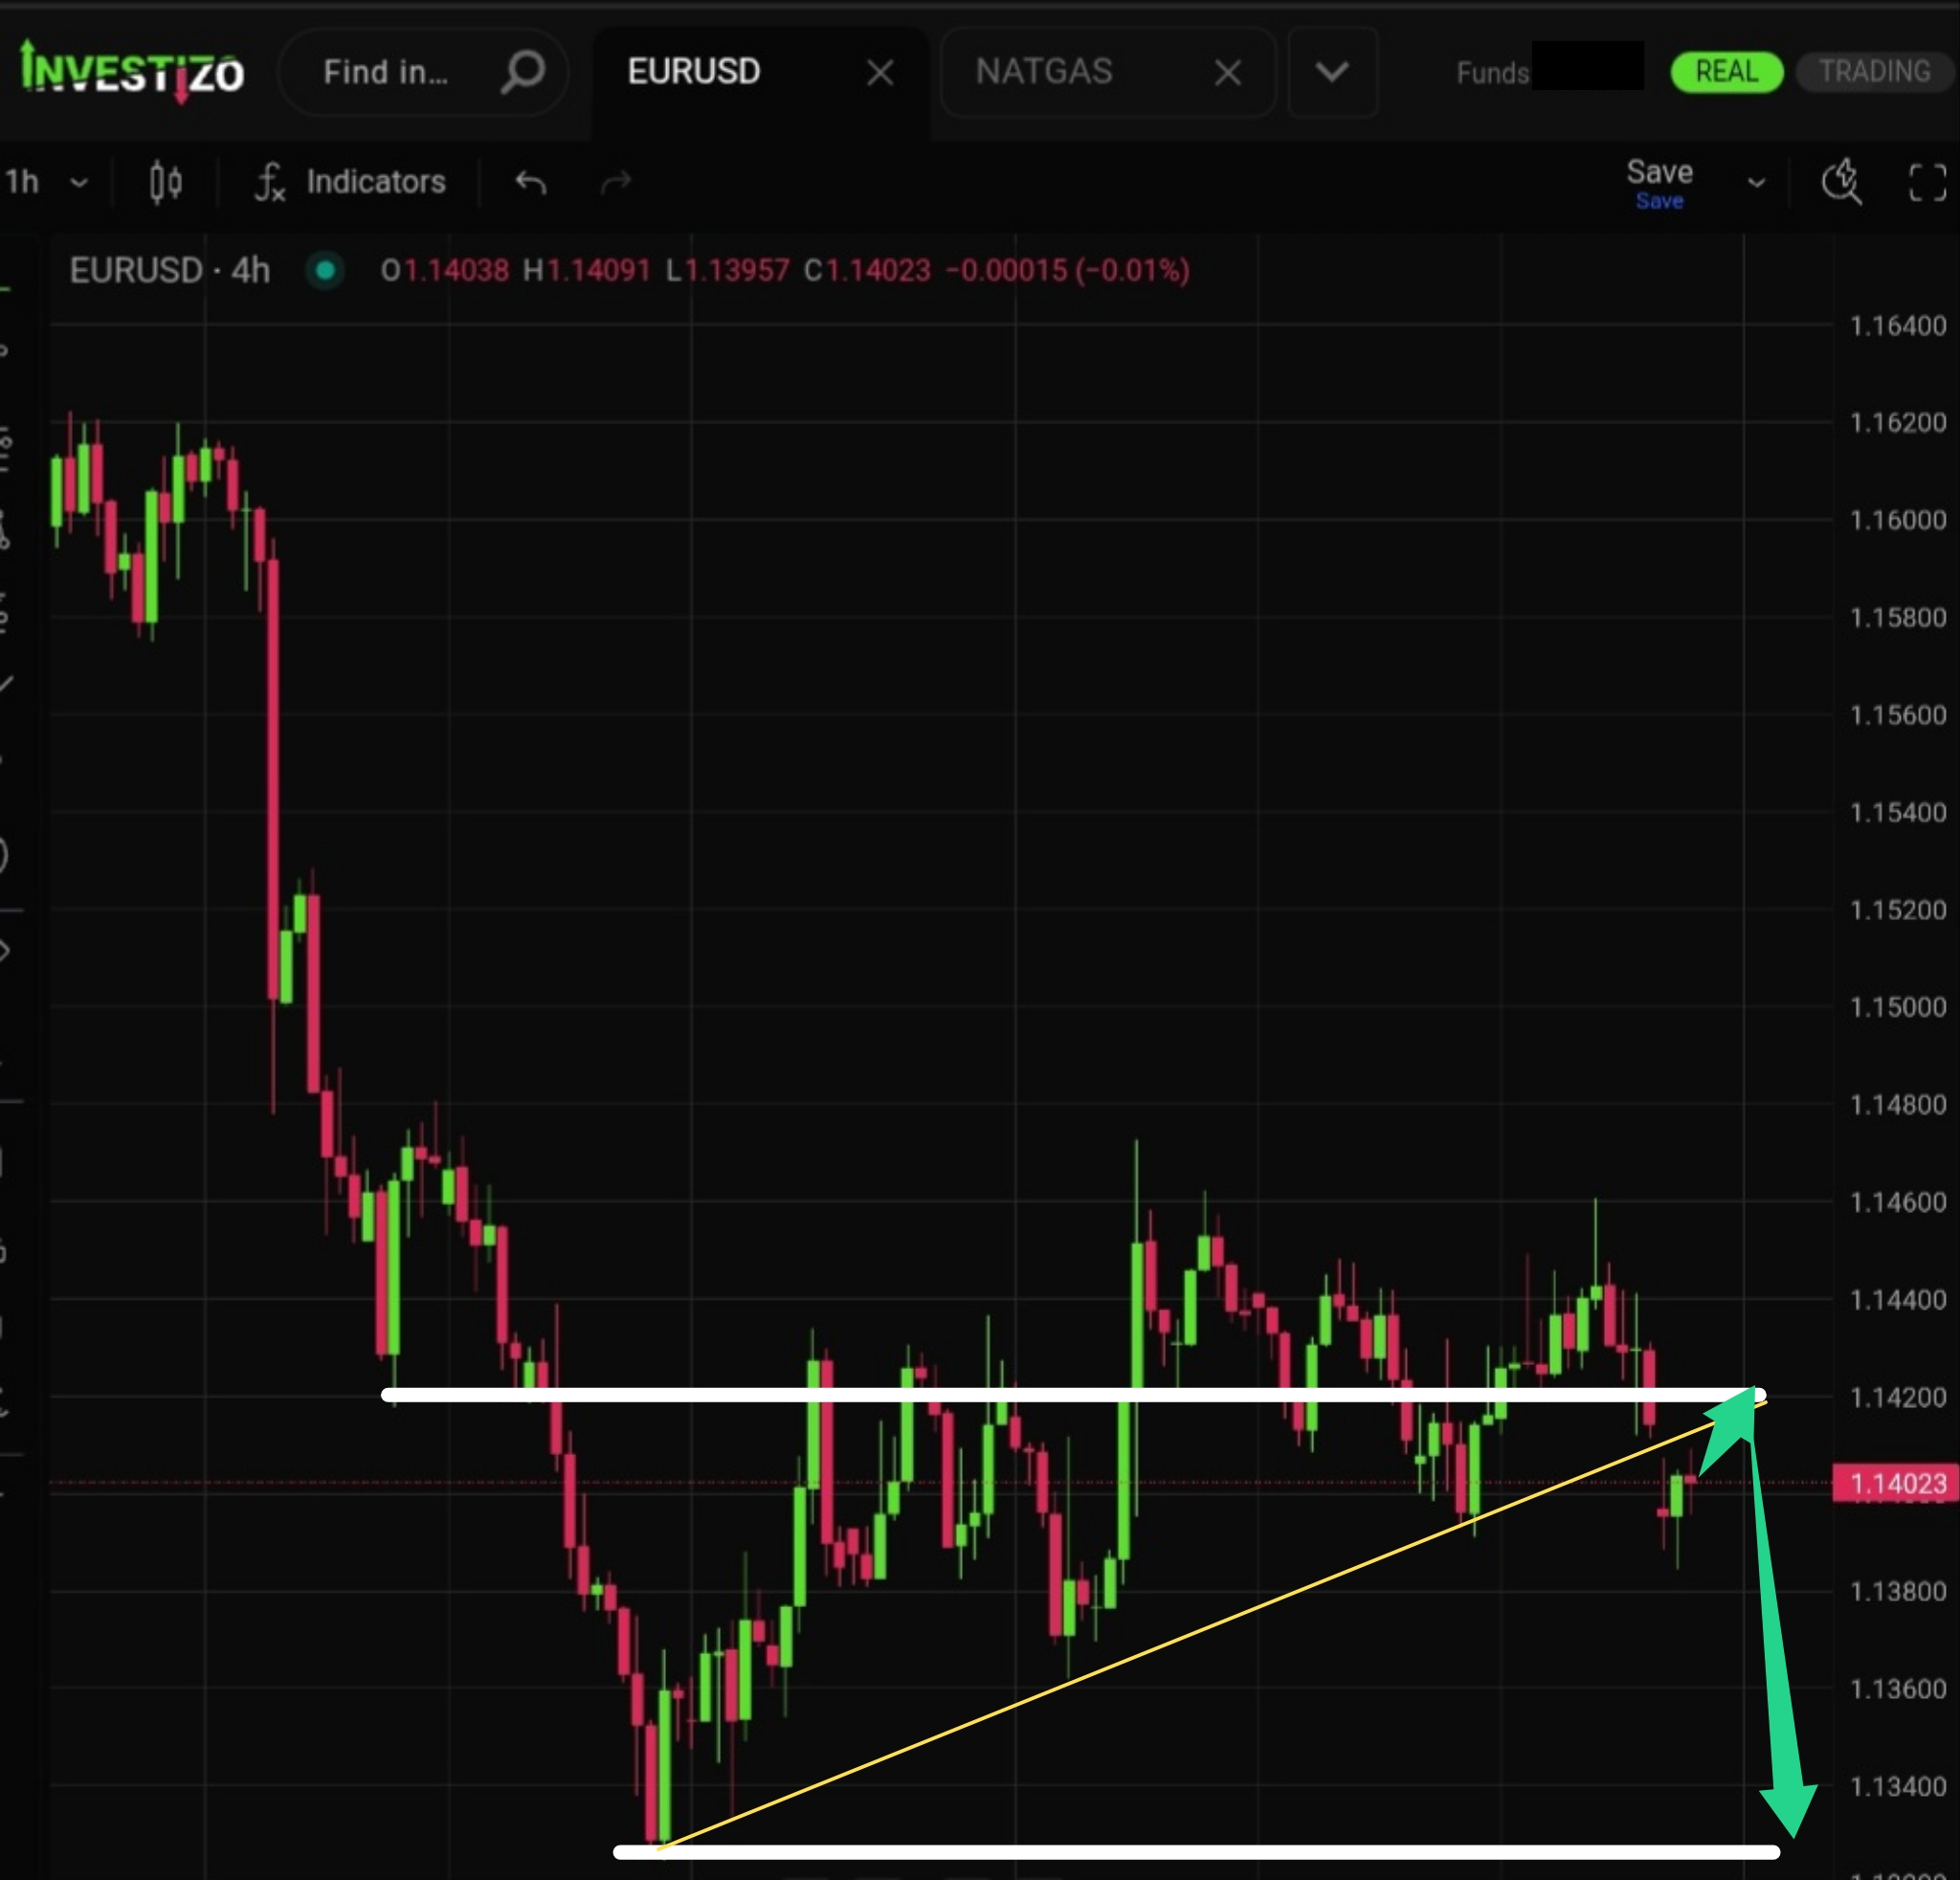
The sharp escalation of hostilities in Iran and the Strait of Hormuz has bolstered the US dollar against the euro.
Bitcoin (BTC/USD) trades at 62,770 this Monday morning, closely tracking a risk-averse macro environment as the escalating military hostilities between the US and Iran eclipse native cryptocurrency indicators.
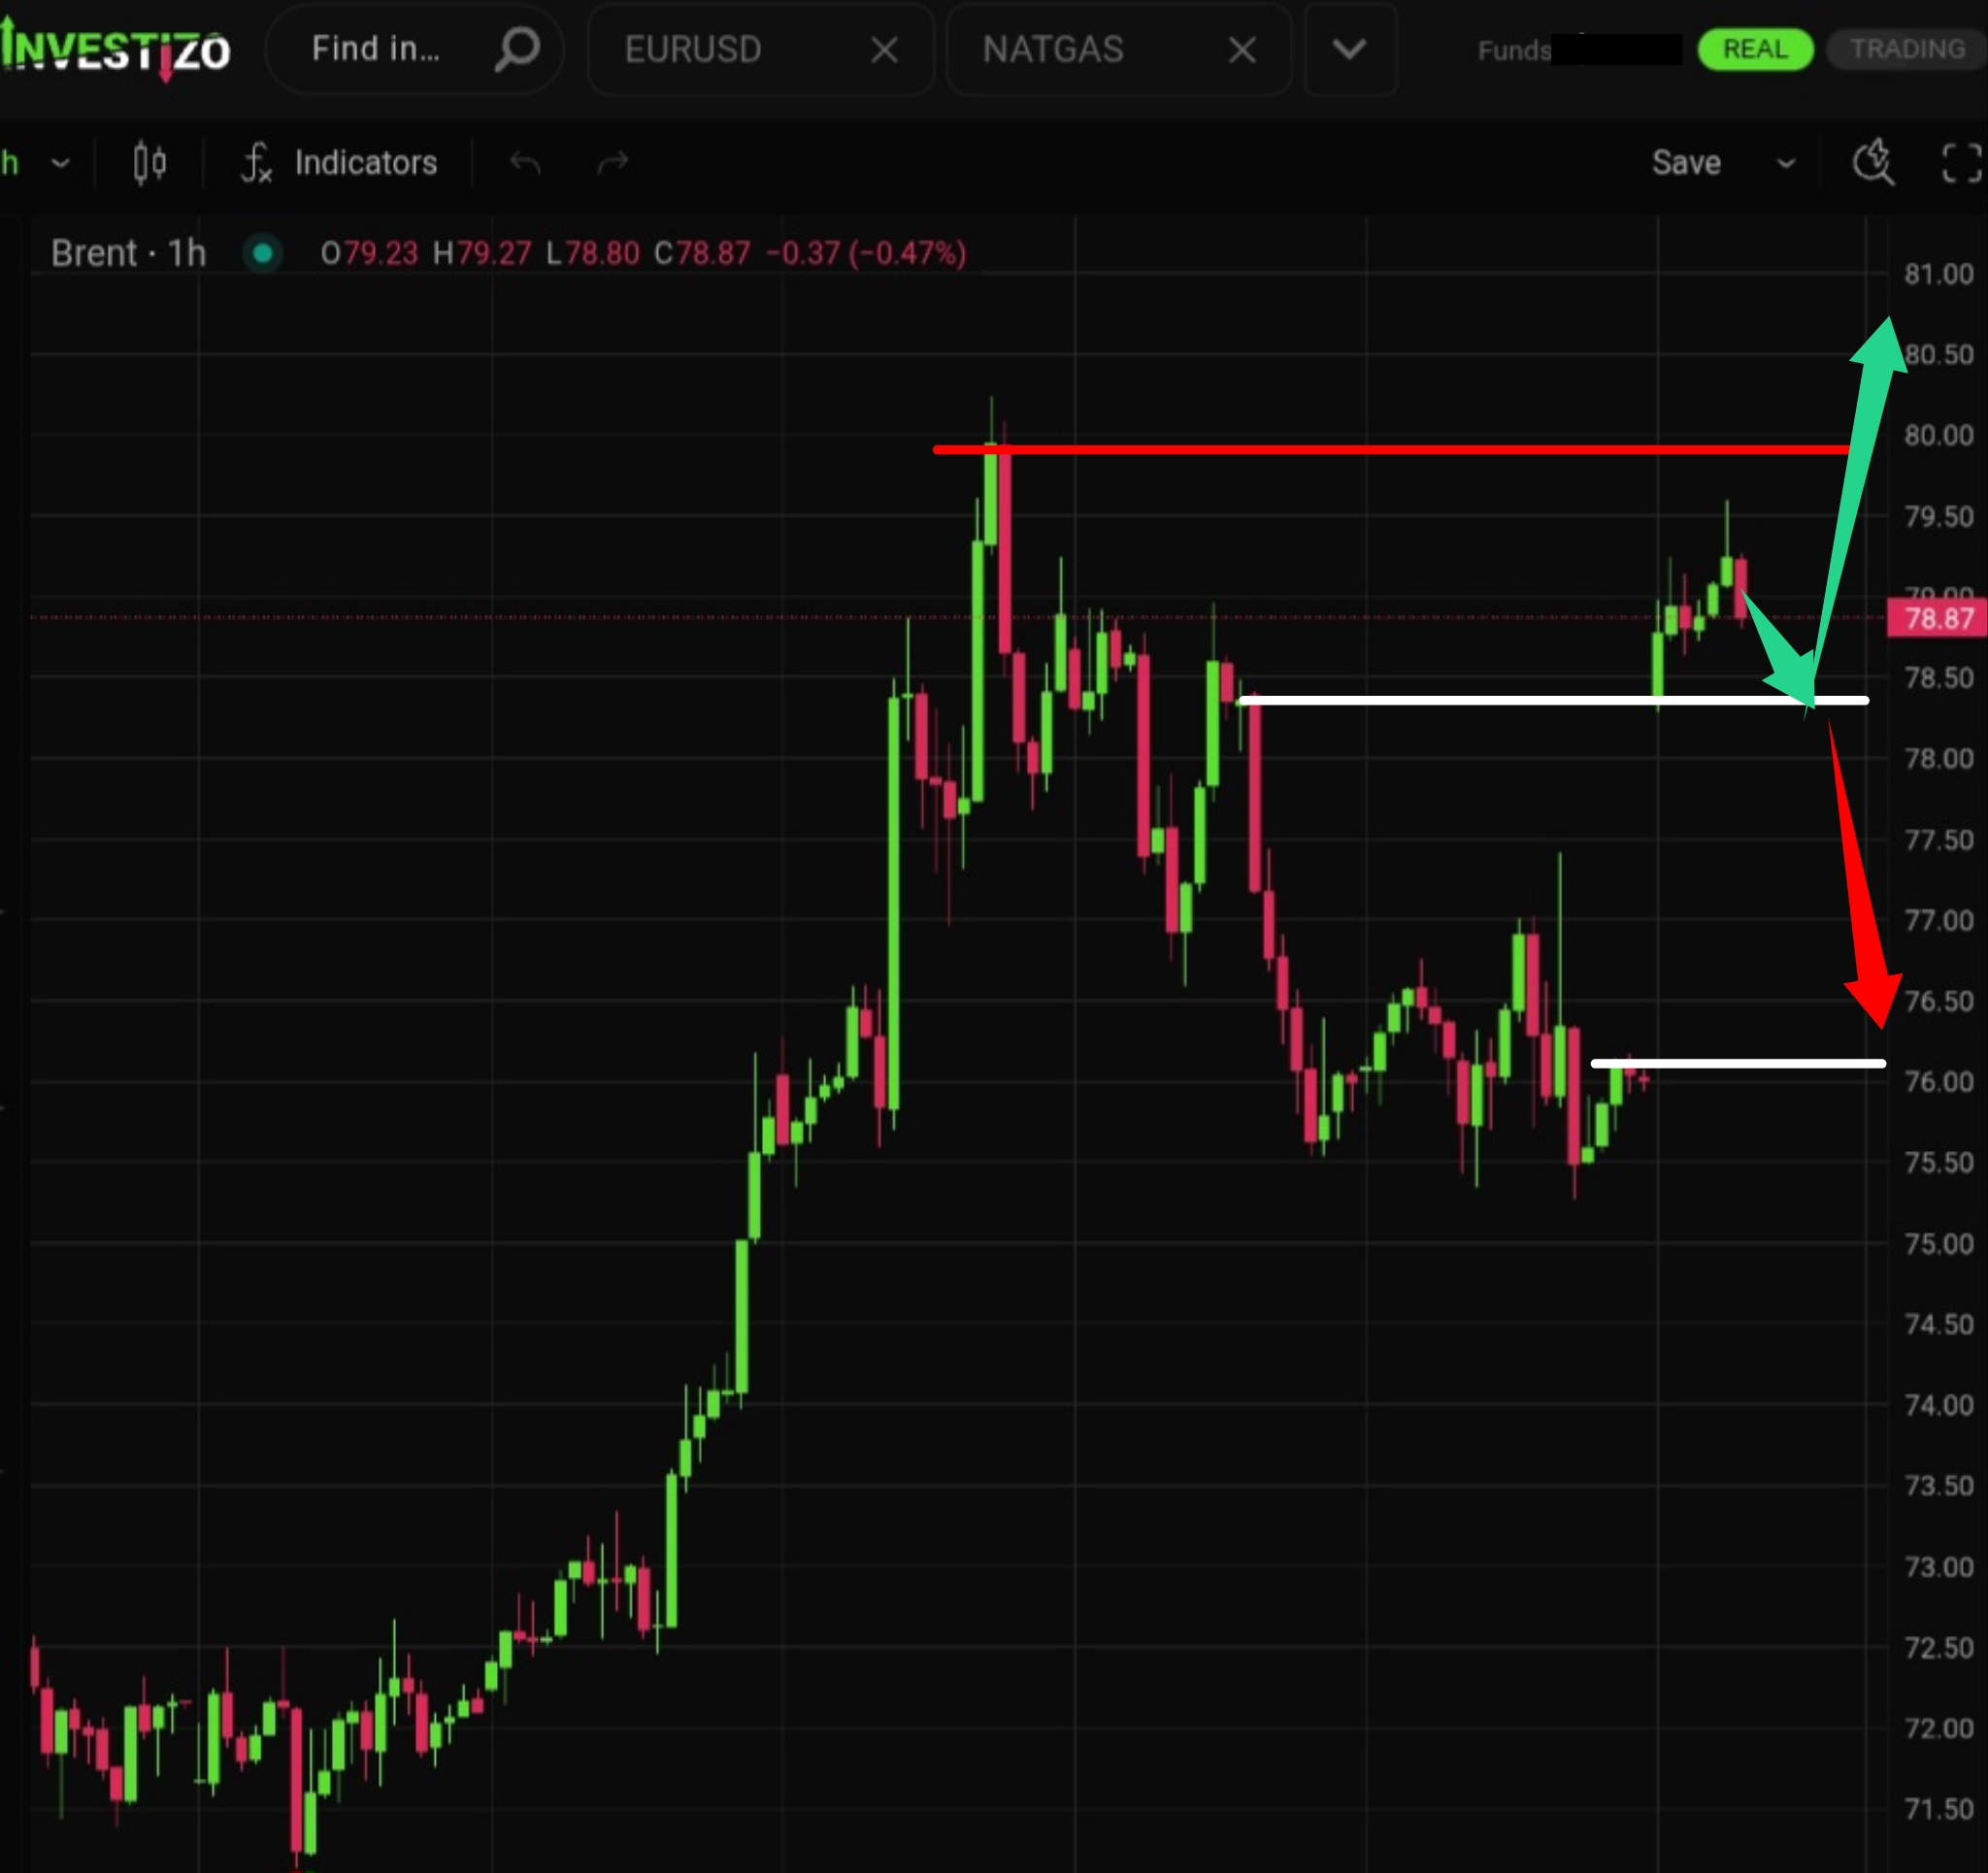
Brent Crude opened the week with a violent 4% gap up, trading at $78.87 this Monday morning following a sharp intensification of Middle Eastern military hostilities over the weekend.
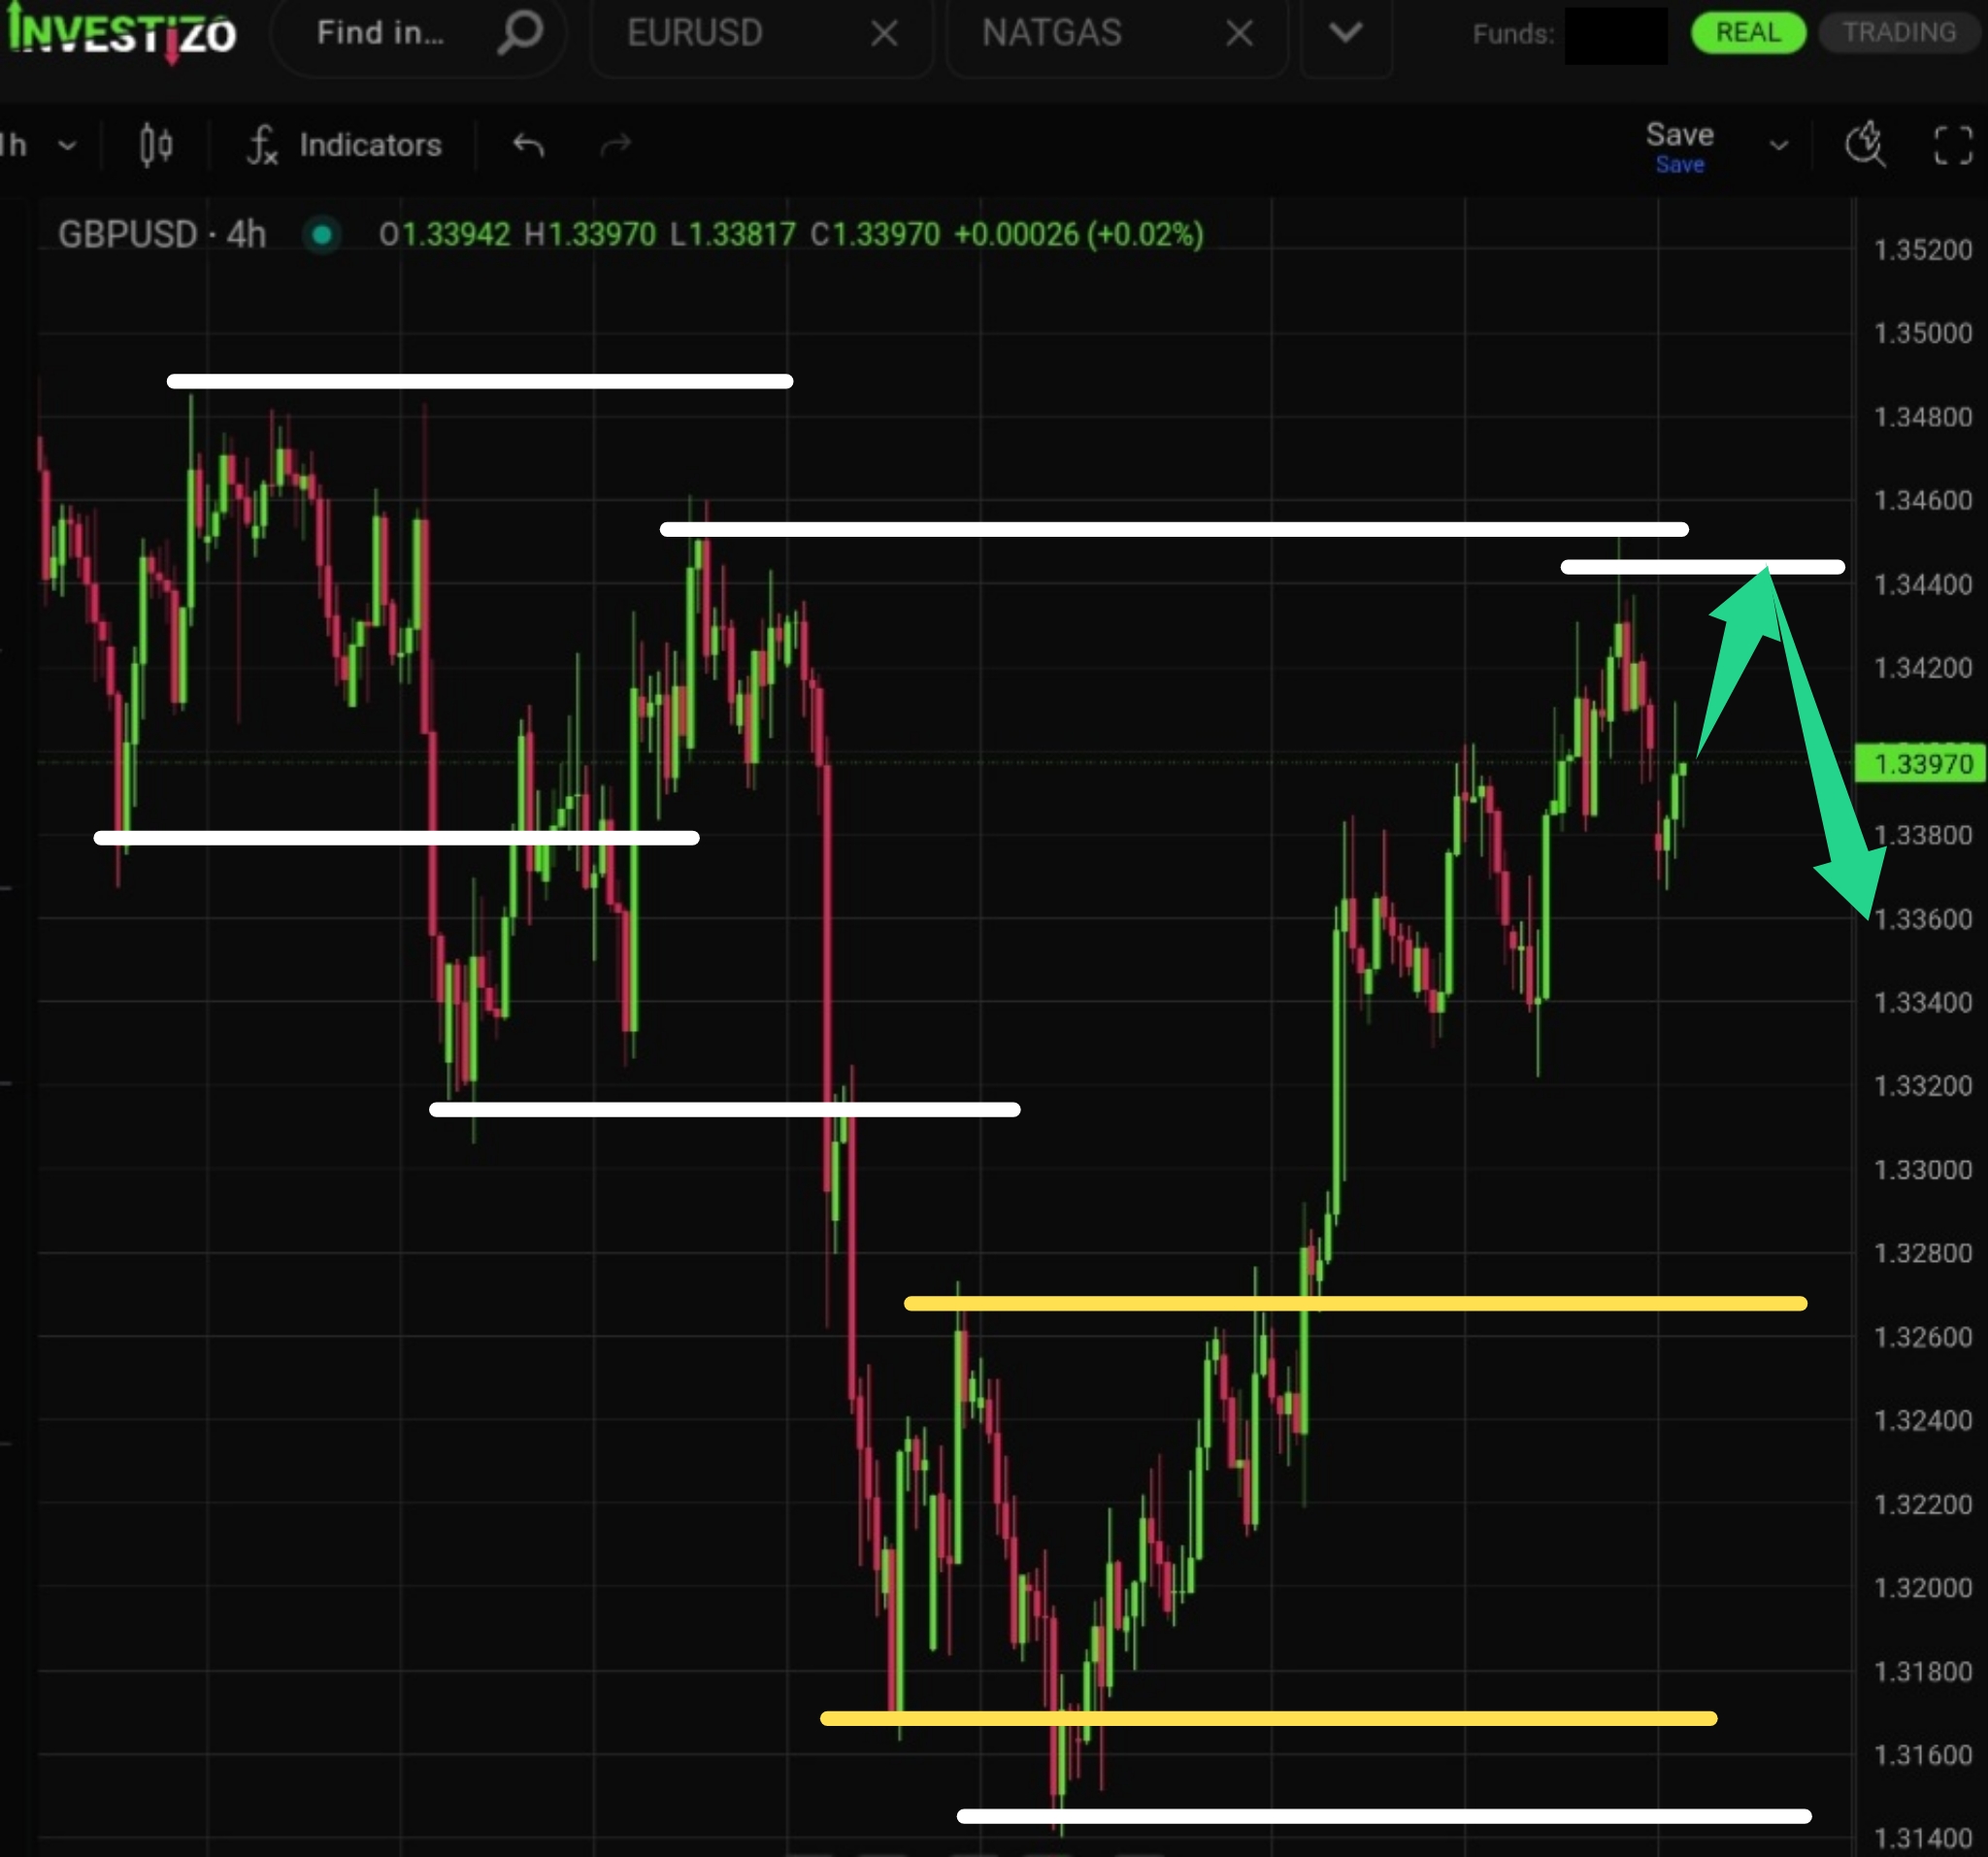
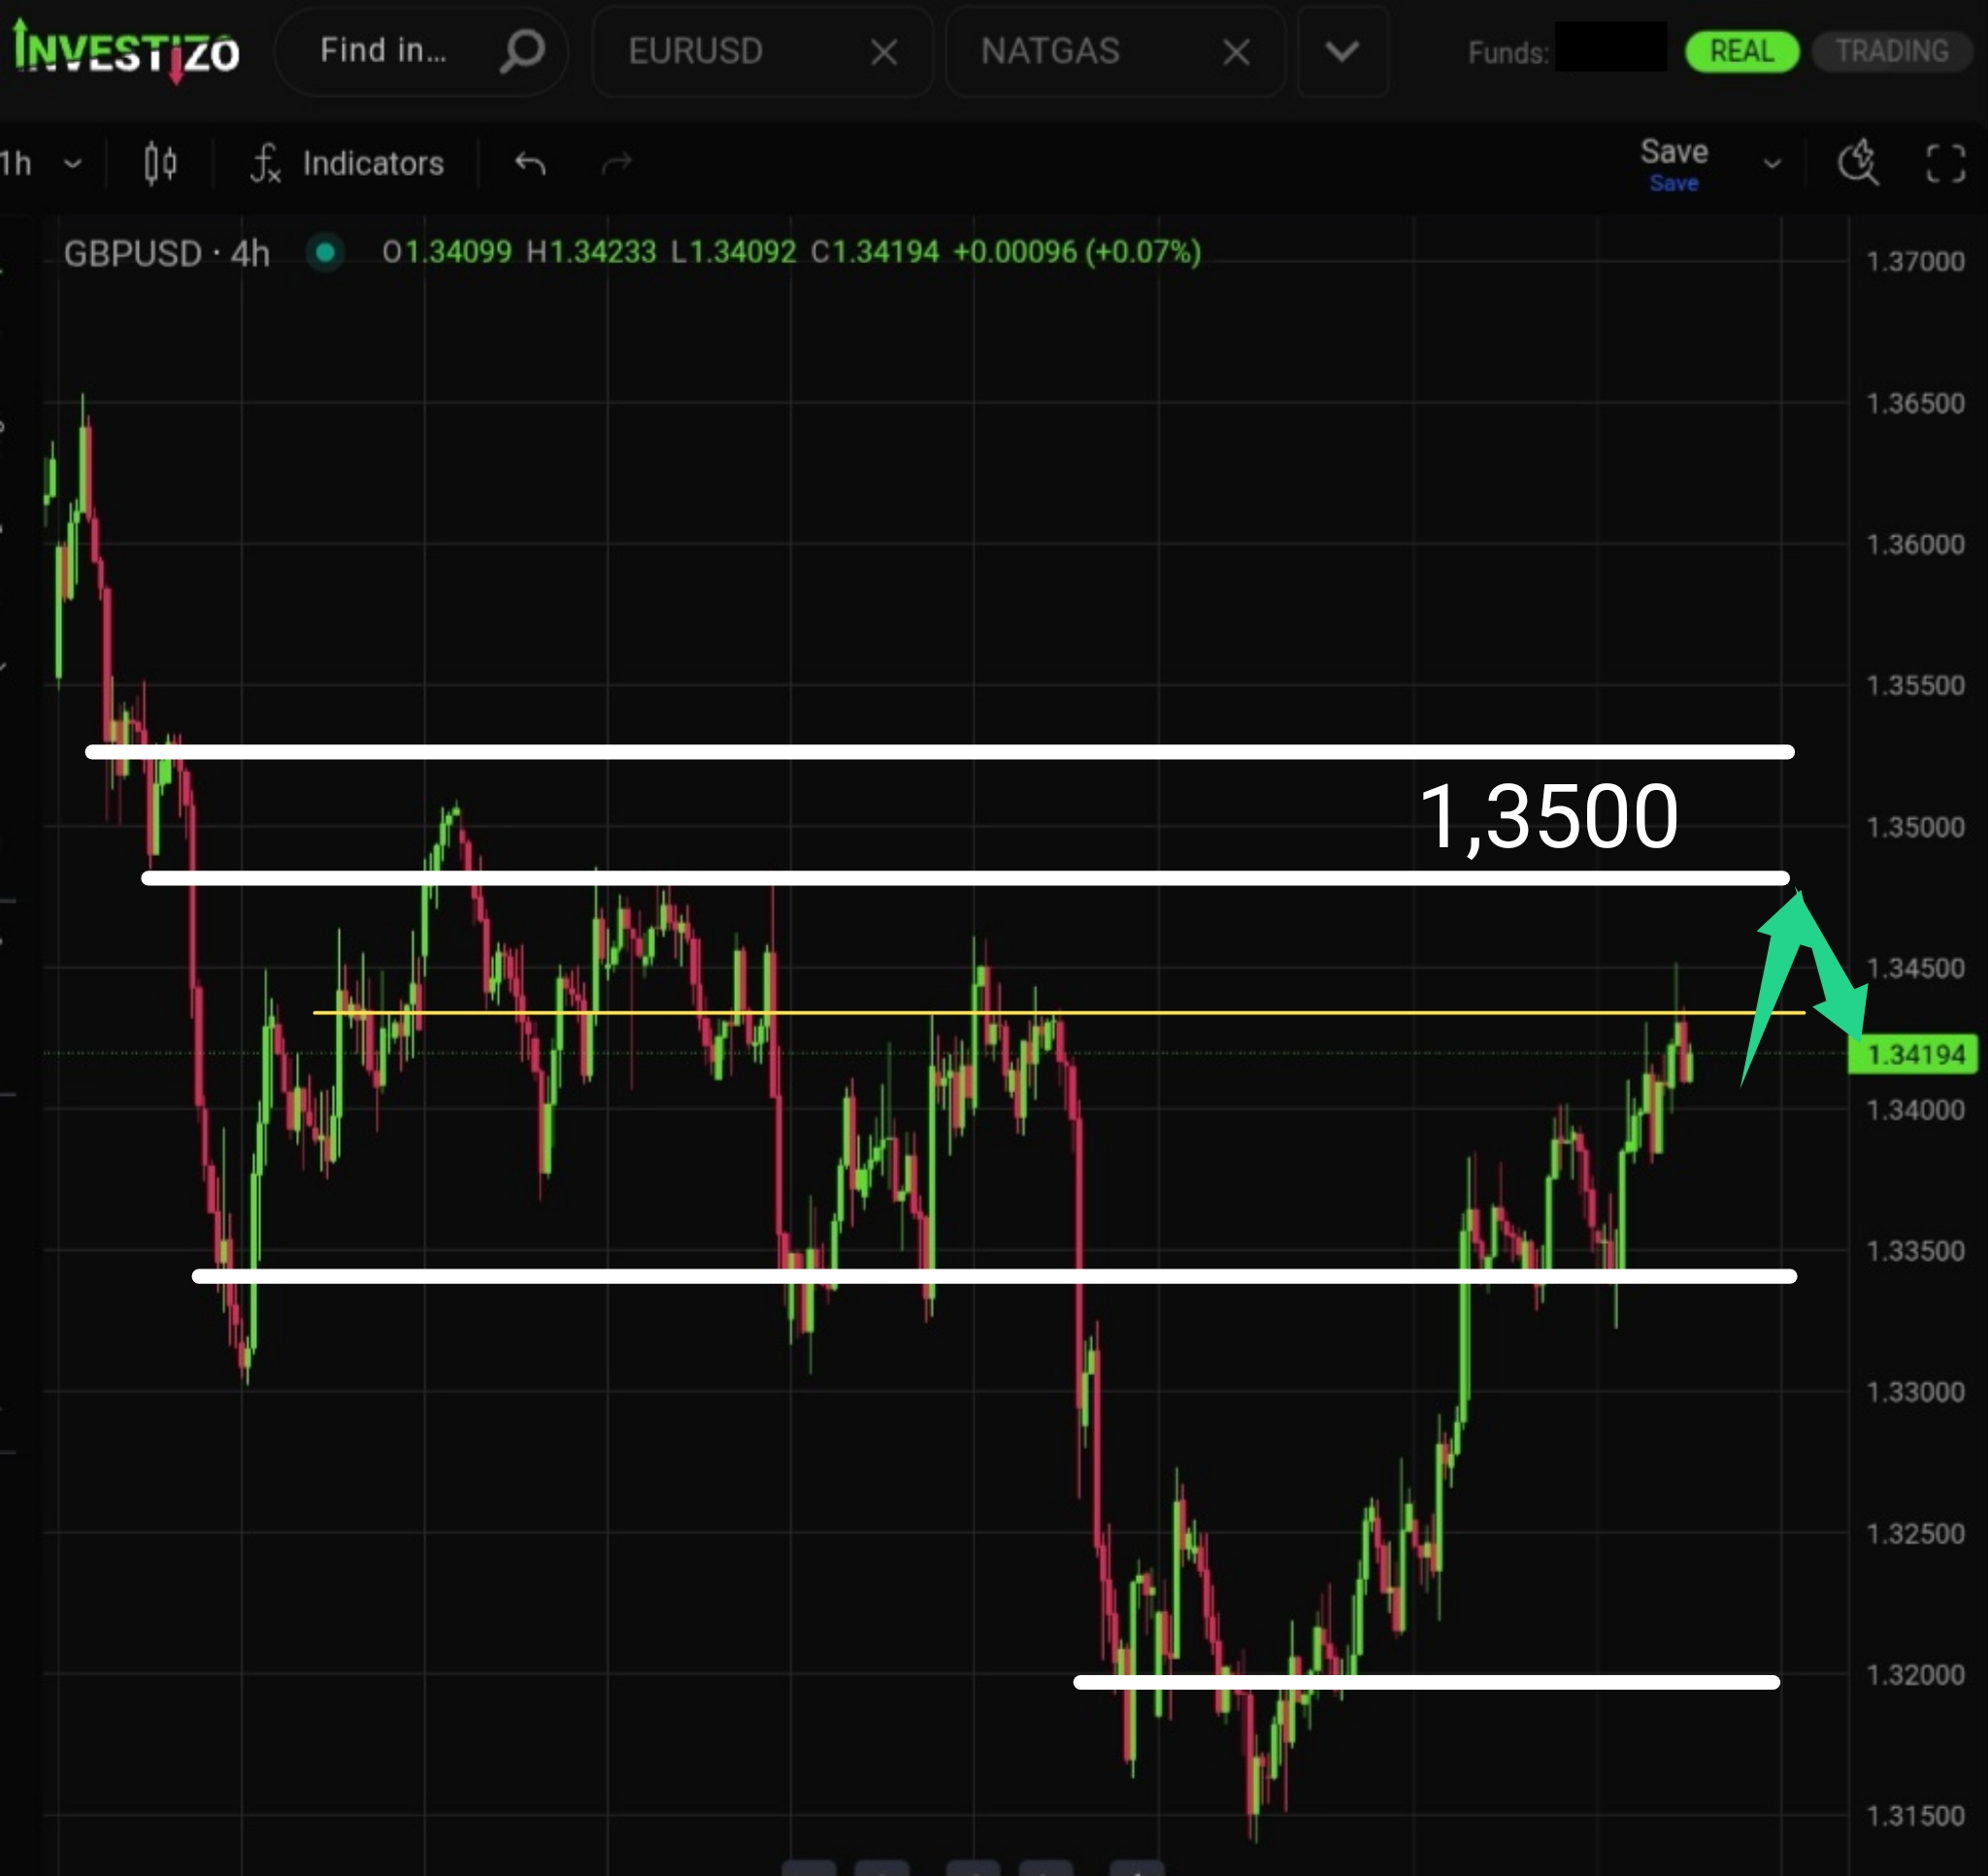
GBP/USD remains in a short-term uptrend but is nearing a major psychological resistance level that could limit further gains.
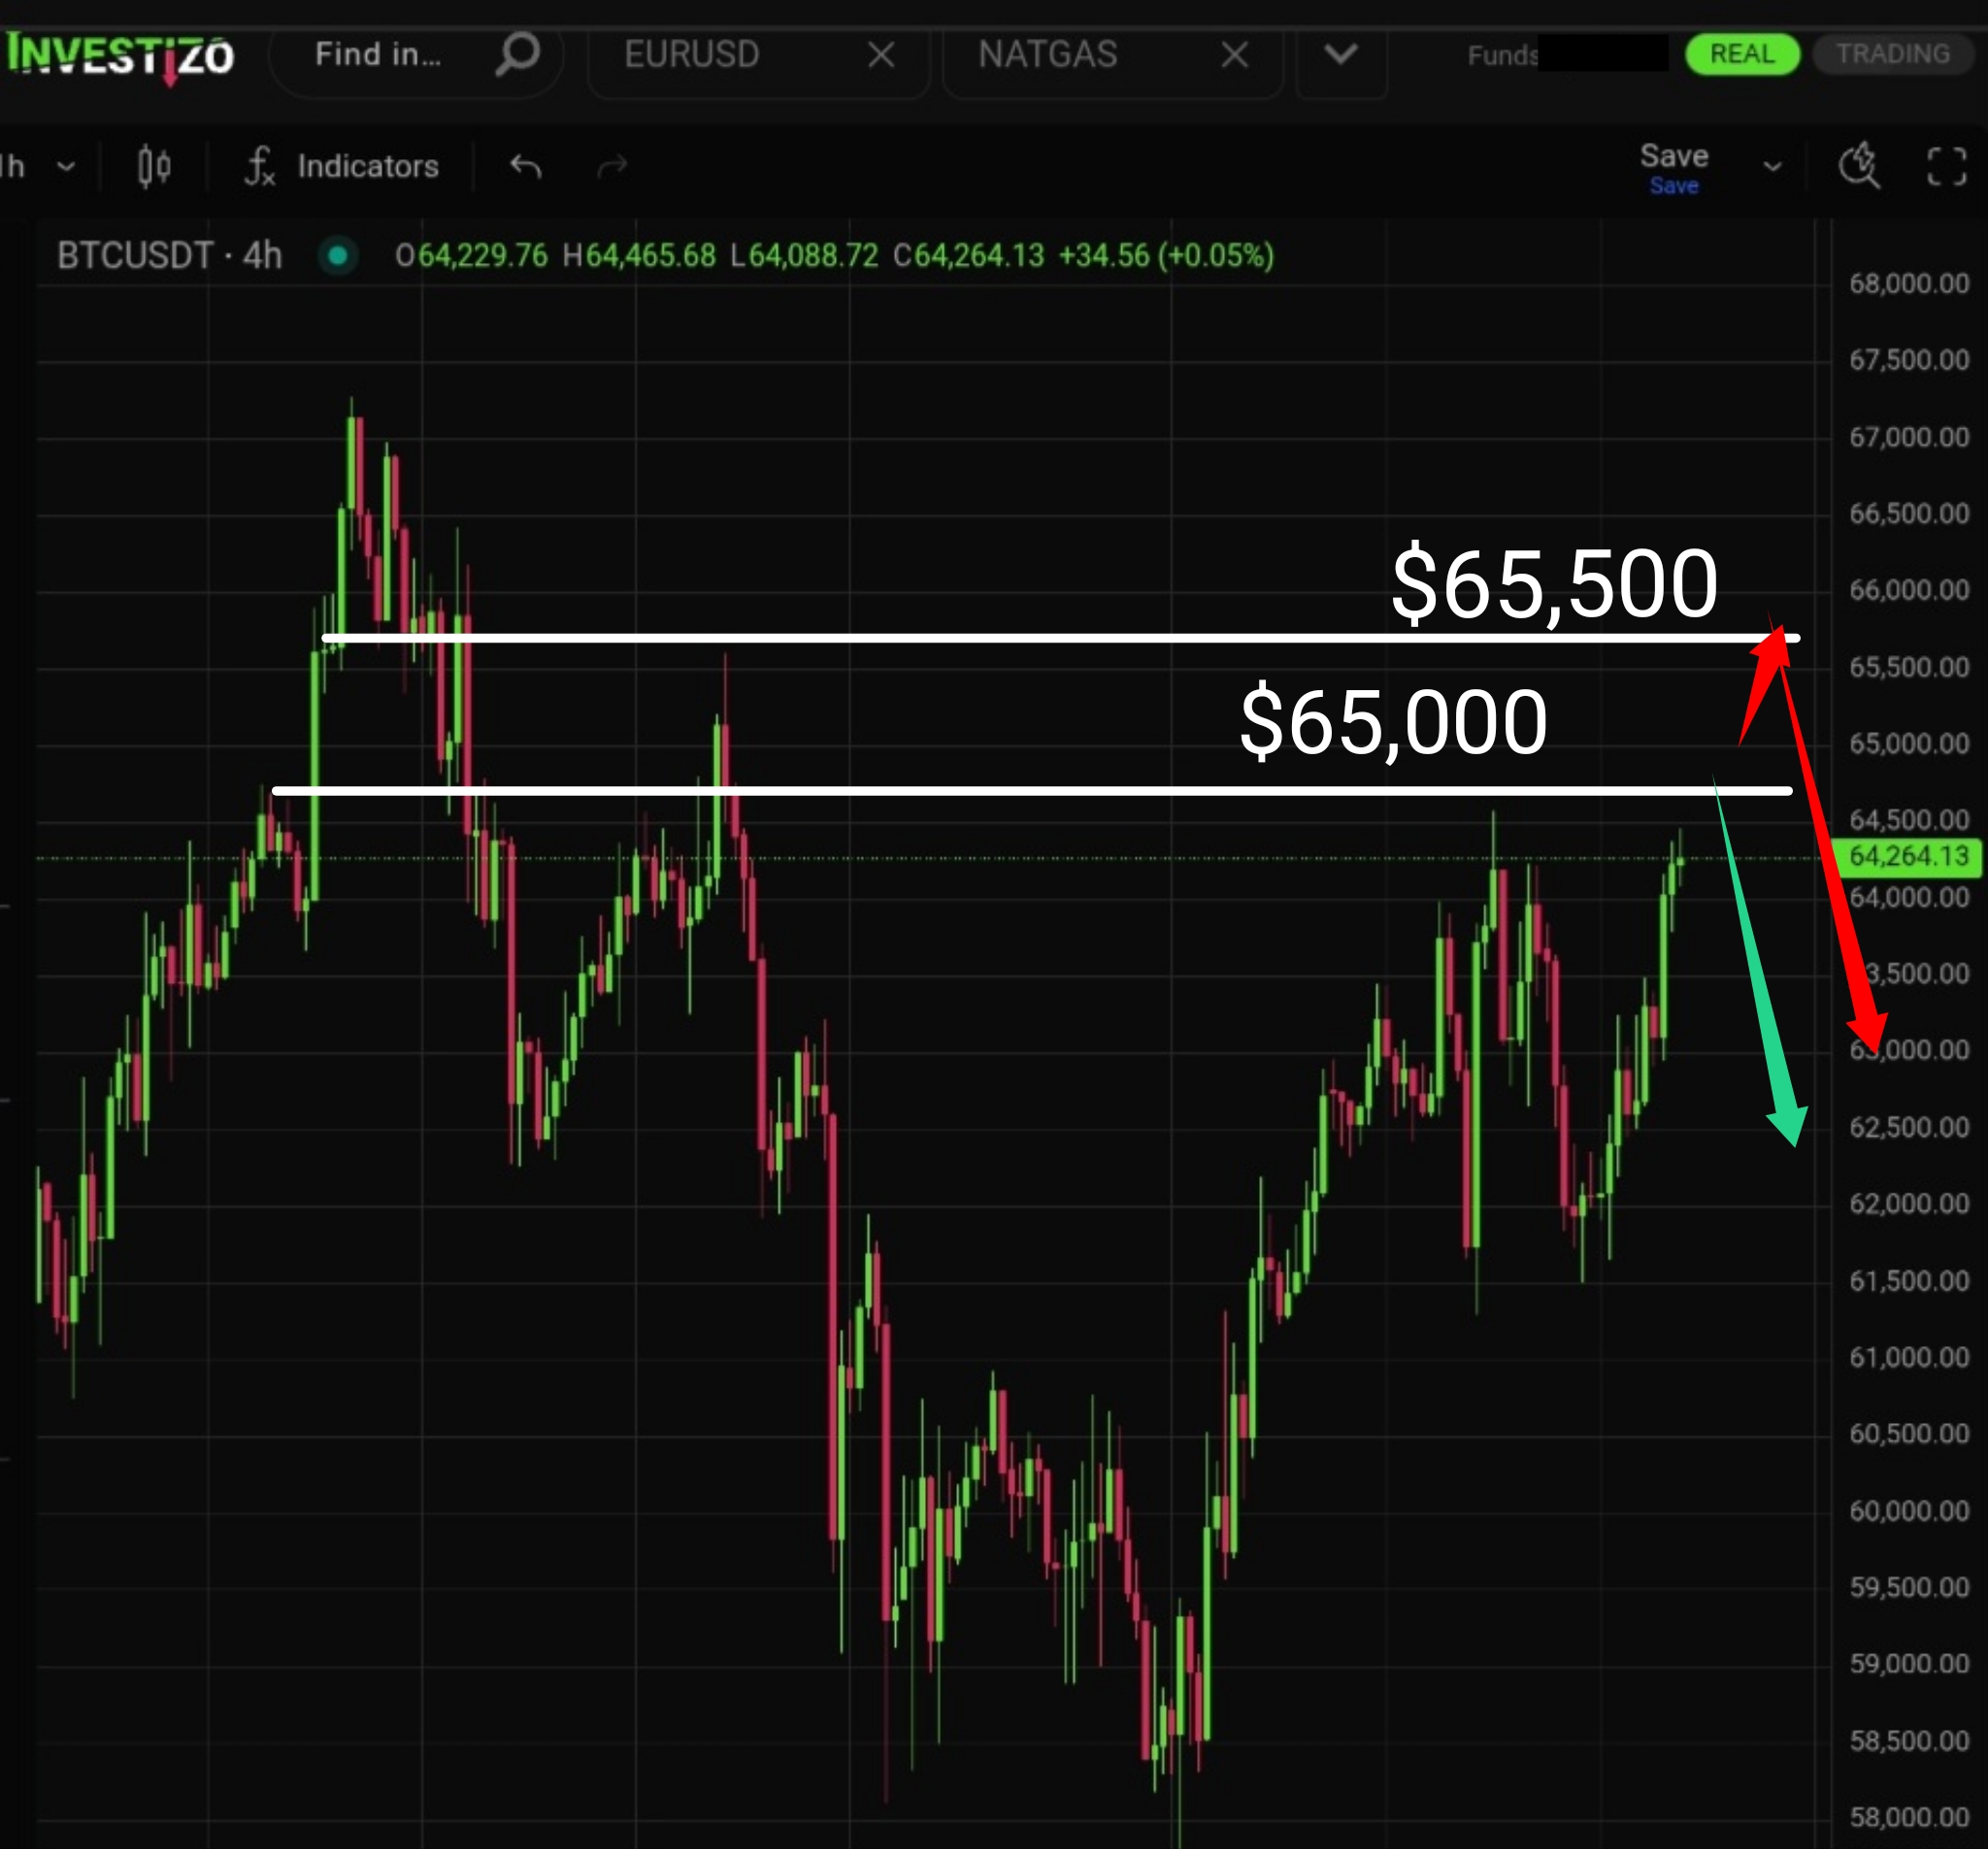
Bitcoin is extending its recovery, but the rally is approaching a key resistance zone where bullish momentum could begin to fade.