
Crude Oil Price Forecast for Today, Tomorrow, Next Week, and 30-Day Forecast

Clear oil prices forecast with key levels, market drivers and outlook for today, the week ahead and the next 30 days to guide trading decisions.
This WTI oil technical analysis covers the main factors driving oil prices: OPEC+ decisions, US inventory data, geopolitical risks, and global demand. See why Crude oil remains a highly liquid instrument for trading in the market, and follow the latest oil price forecast for crude oil.
Key Takeaways
On the intraday timeframe, the market broke below the local upward structure after testing $95.00; further downside toward $92.00 remains possible, with a technical pullback to the $94.00–$94.50 zone as the more likely near-term path before any continuation lower.
On the weekly view, the broader structure stays constructive even if a deeper correction toward the high-80s develops, provided key supports hold.
Over the next 30 days, the fundamental balance of constrained supply, elevated geopolitical risk, and still-tight inventories continues to favor relatively firm prices, though the trajectory will depend heavily on the pace of Middle East supply recovery and the next OPEC+ decision on 1 November.
Latest WTI Crude Oil Technical Analysis for Today
H1: WTI reached $95 per barrel before the market corrected below $93.00, breaking the local ascending structure. Further declines are therefore possible both from current levels and after a technical rebound toward $94.00–$94.50.
RSI: 42,02
MACD: Bearish
MA: $93,05
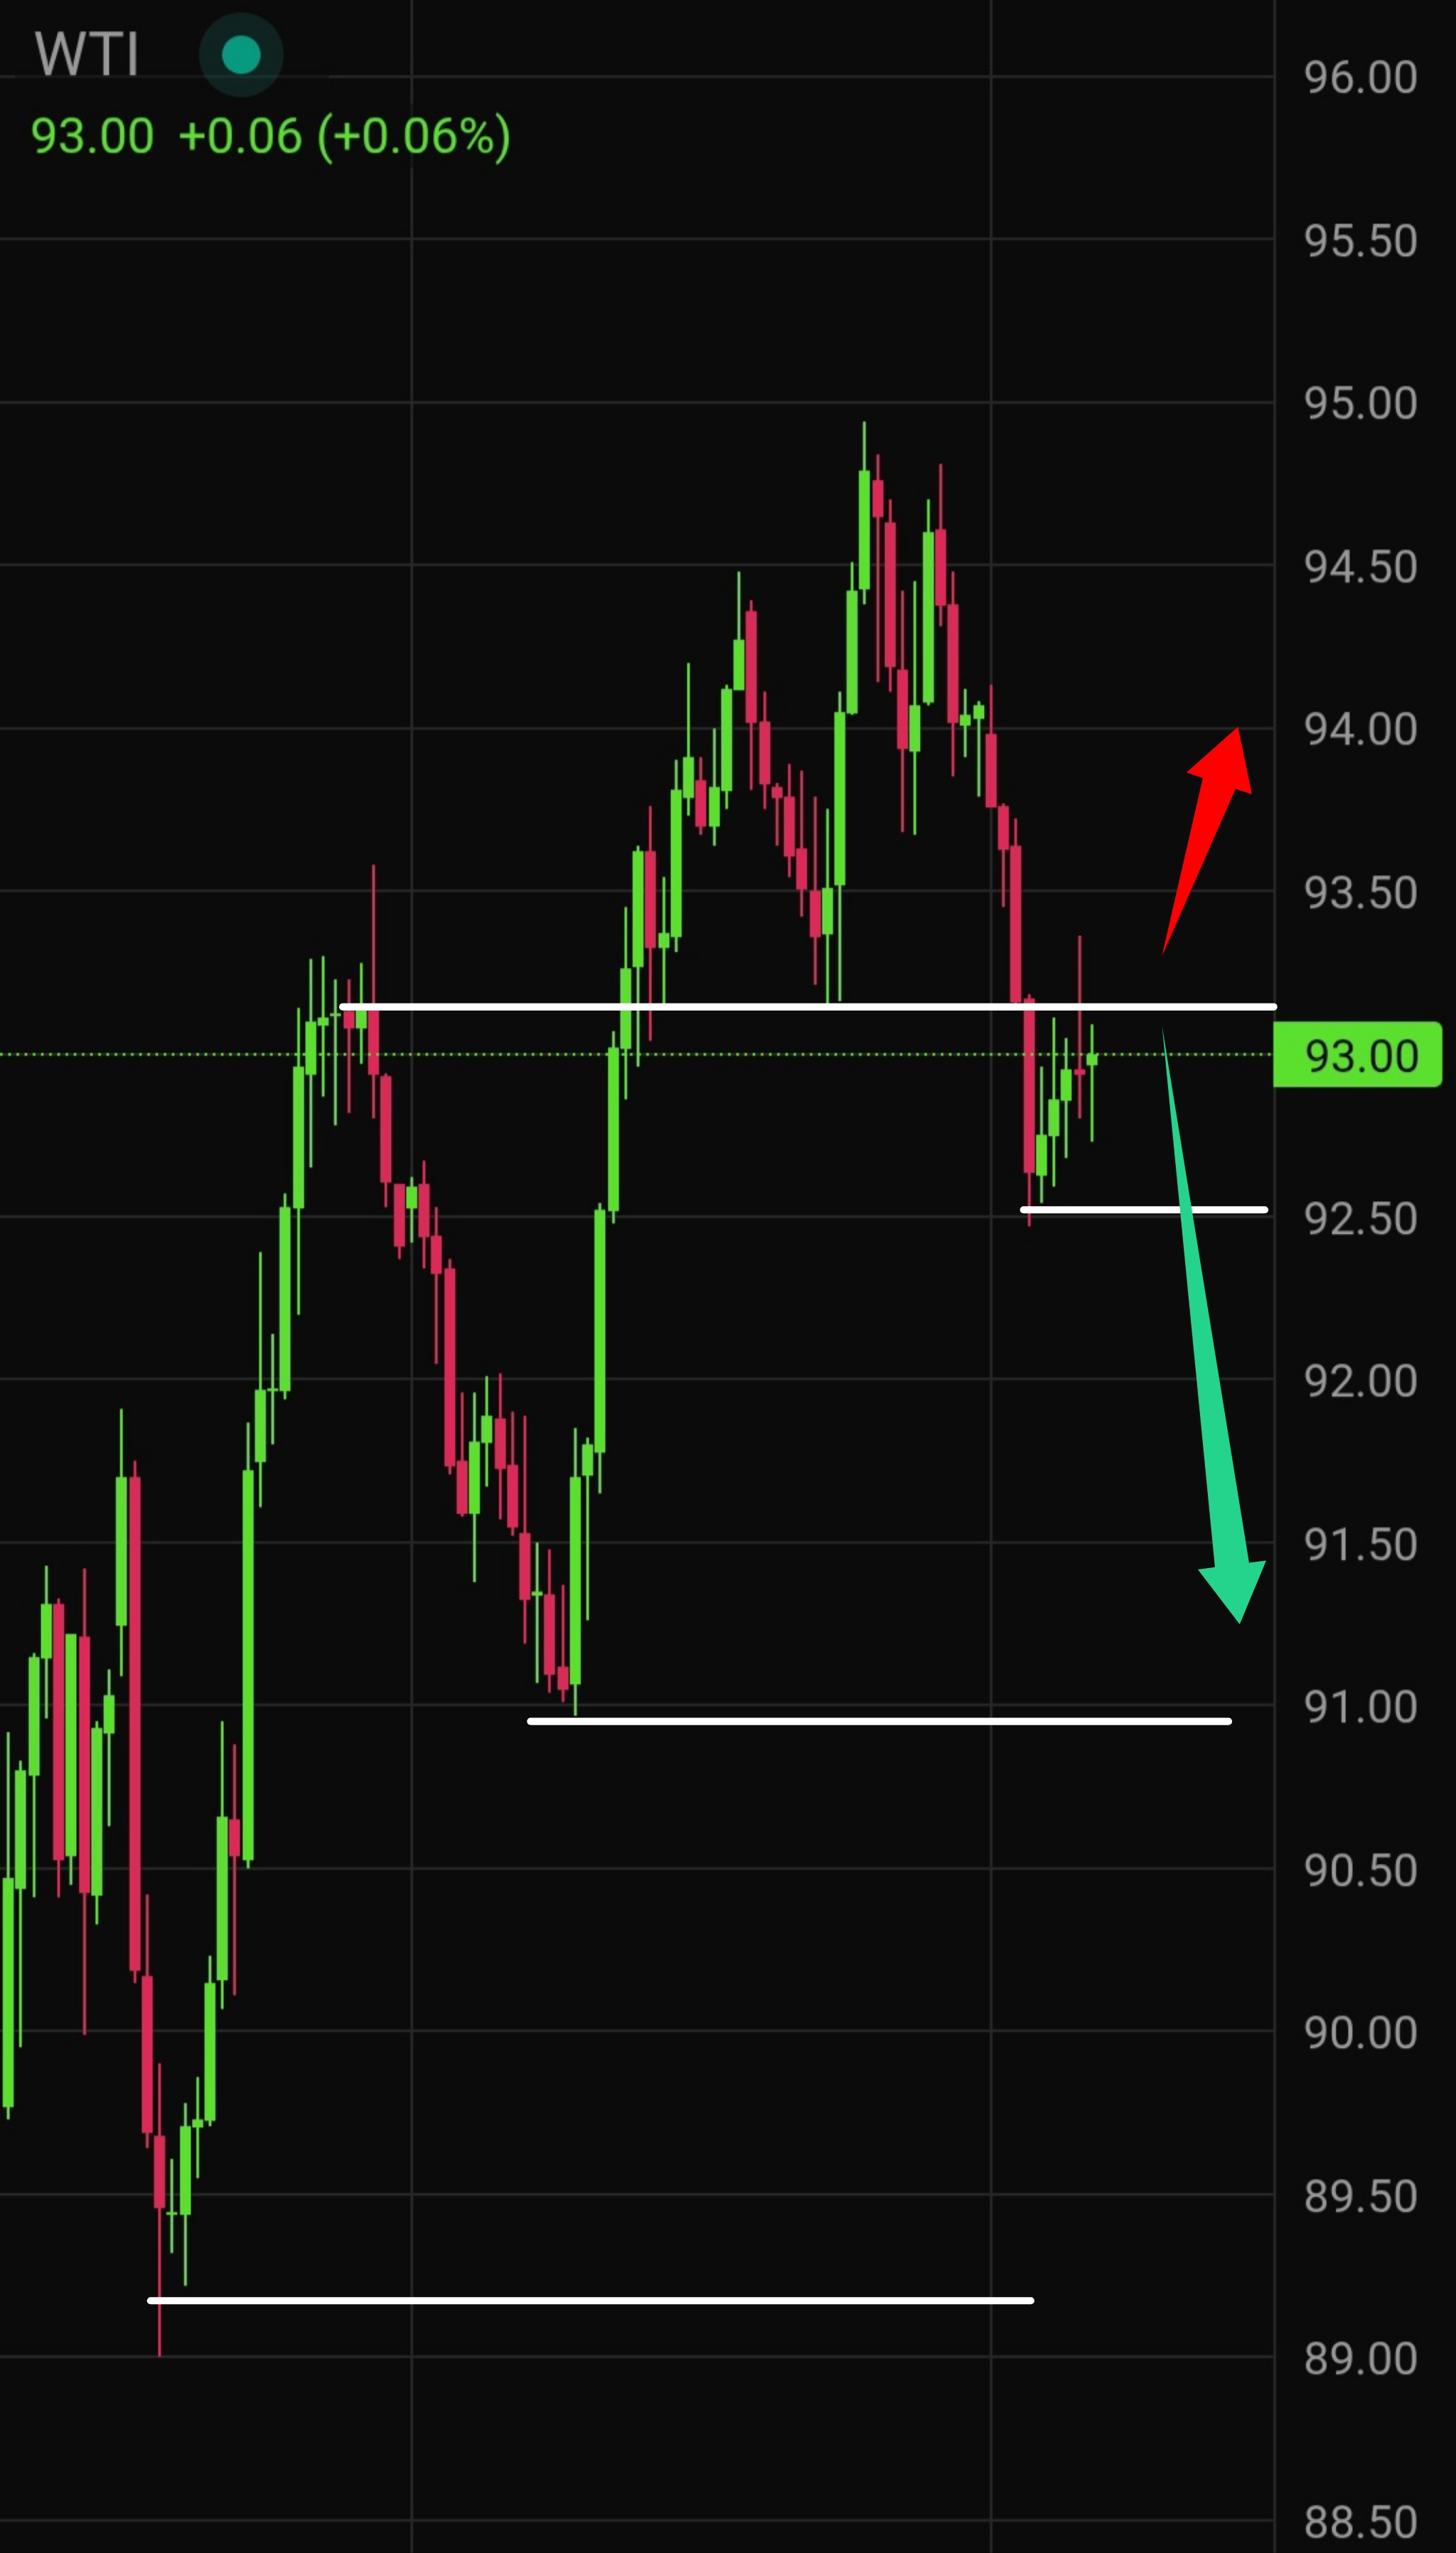
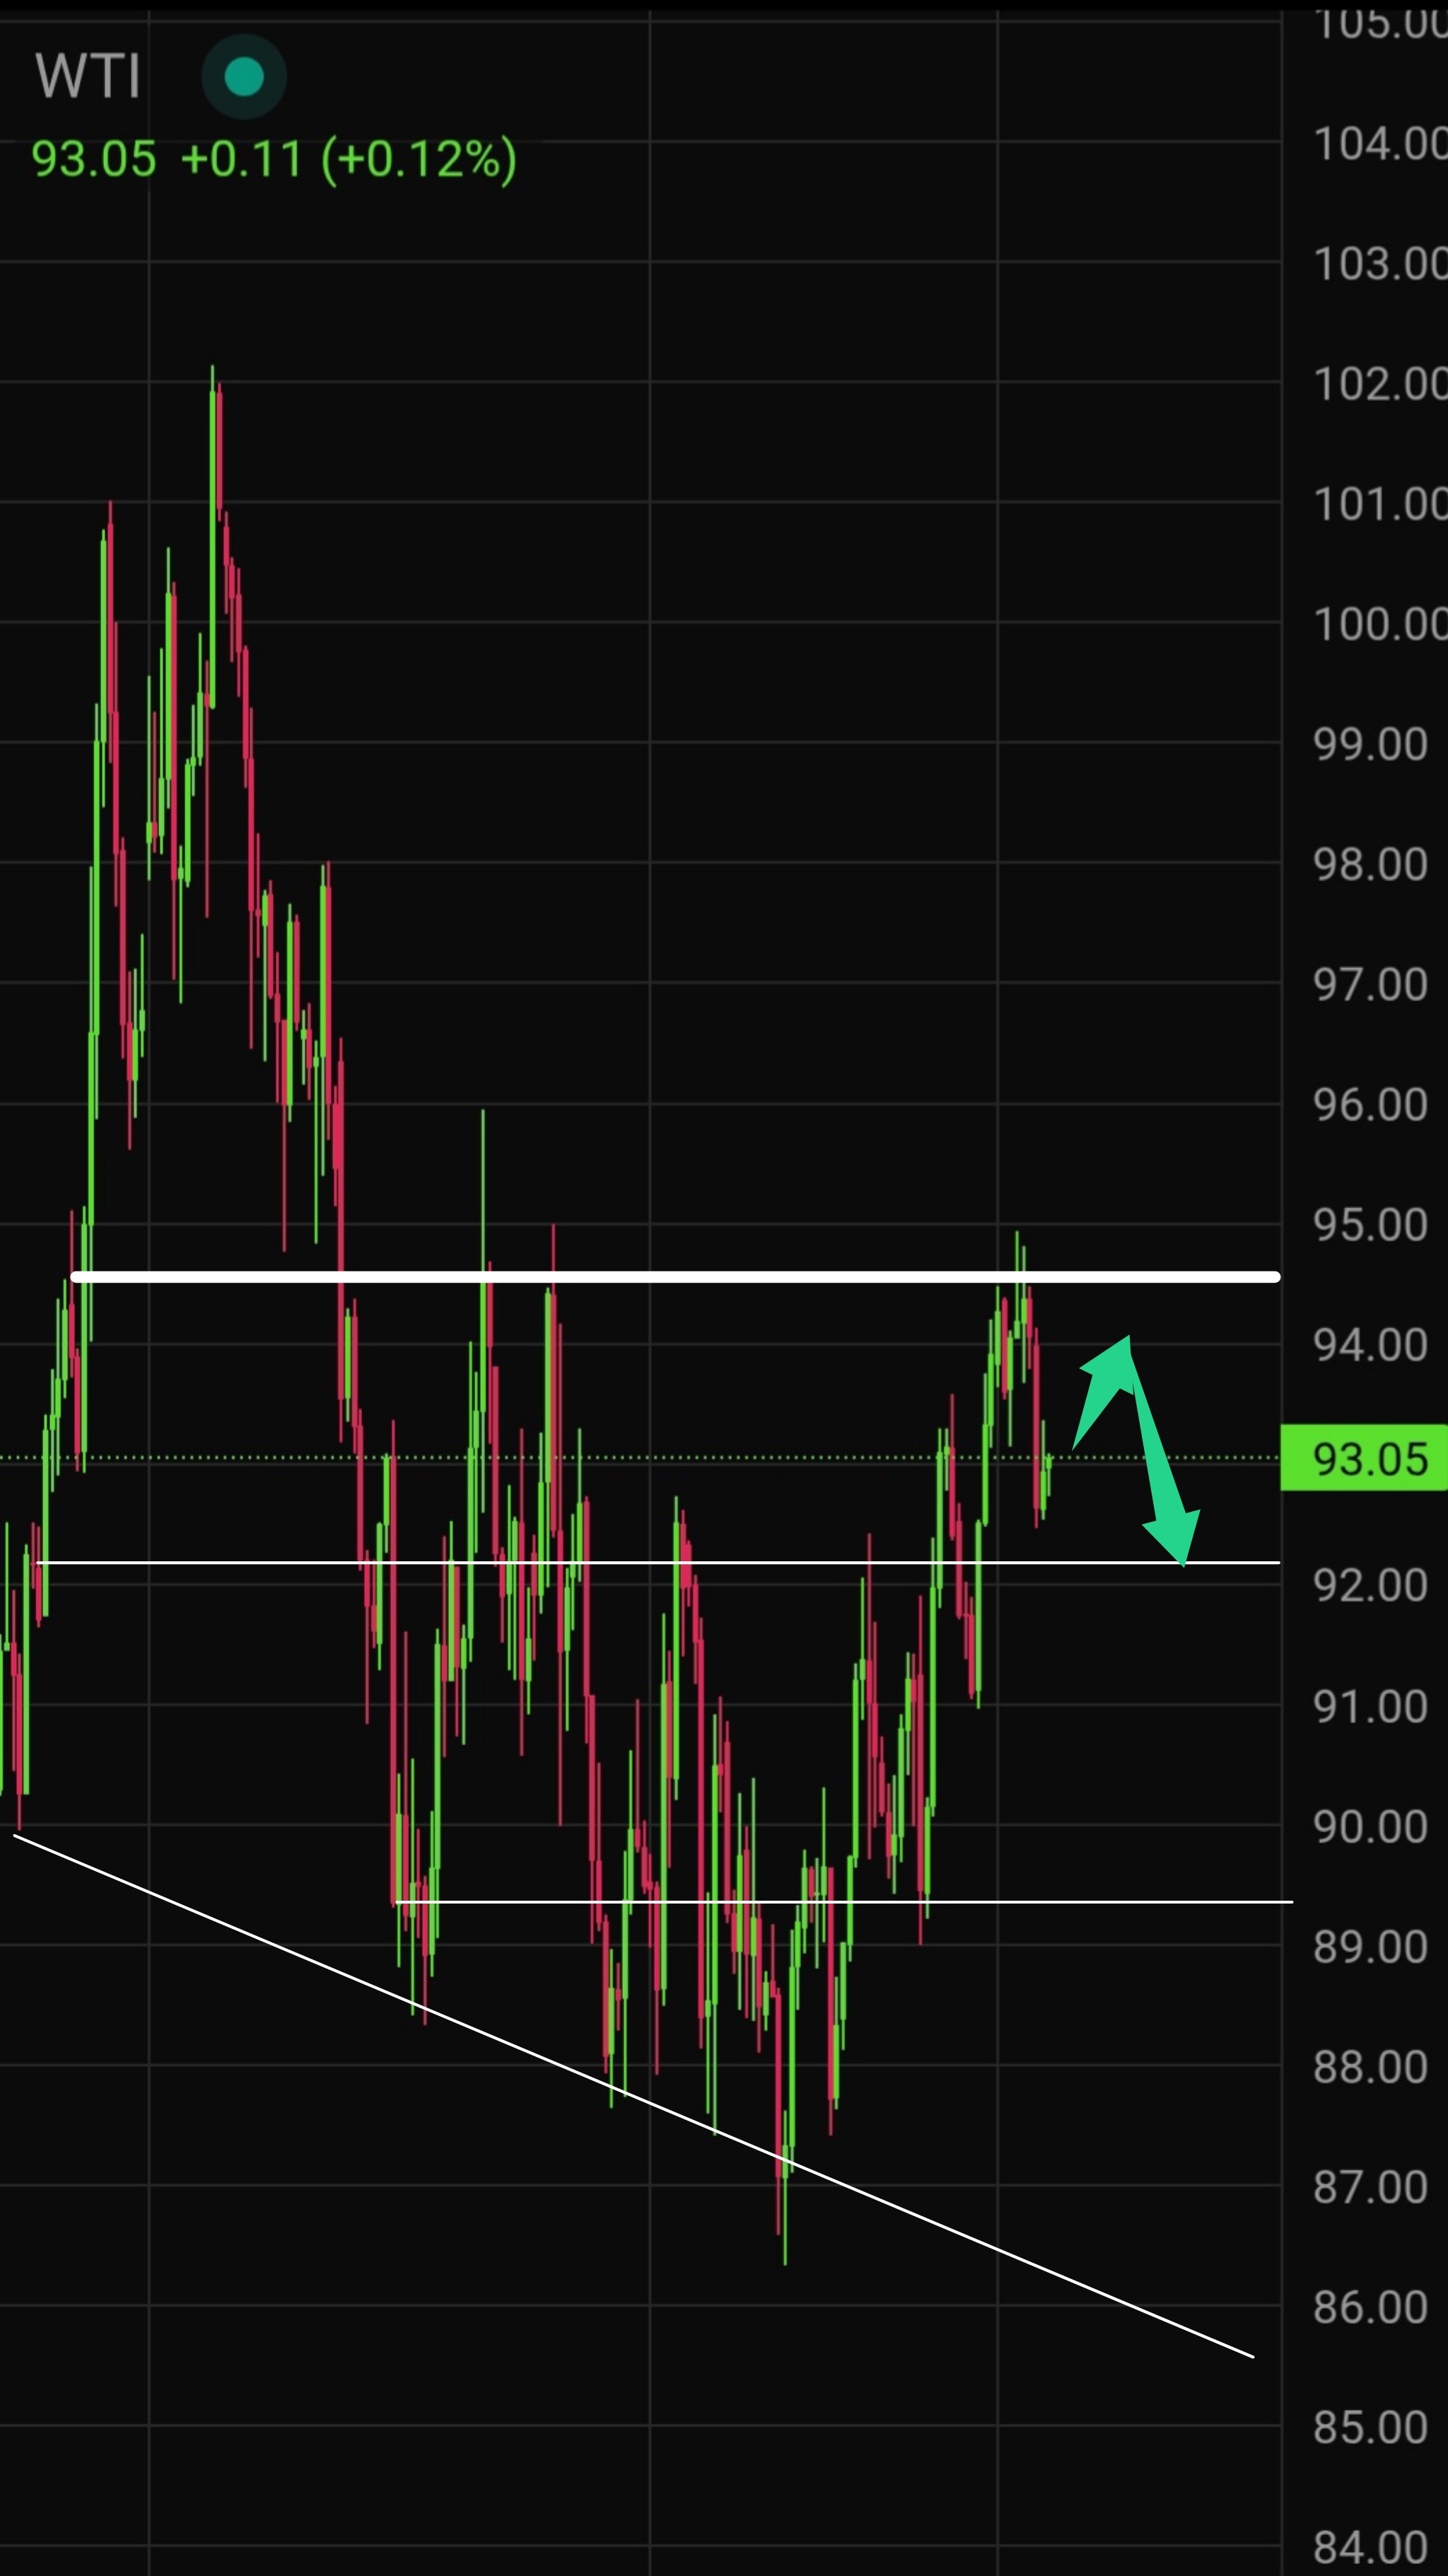
H4: The next downside objective for sellers sits near $92.00. A preliminary recovery toward $94.00 cannot be ruled out before any renewed pressure develops.
RSI: 53,02
MACD: Bearish
MA: $93,05
Oil Trading Plan for Today
- Supports: $92.00, $91.00
- Resistances: $93.00, $94.50, $95.00
- Base-case scenario: decline toward $92.00.
- Alternative plan: pullback to $94.00–$94.50 followed by a reversal lower.
Oil Live Price Today
WTI opened the session under pressure after the previous day’s correction from the $95 area. The market is digesting a lower IEA demand outlook and elevated supply numbers, while waiting for the delayed EIA inventory report.
Geopolitical risks around the Strait of Hormuz continue to provide an underlying bid, keeping the WTI live price sensitive to any fresh headlines.

Yesterday, 14 October, the International Energy Agency cut its global demand forecast, projecting declines of 2.6 million barrels per day on average in 2026 and 2.5 million barrels per day year-on-year in the fourth quarter. The agency cited the consequences of the conflict with Iran, expensive refined products, and weaker economic prospects.
At the same time, global supply rose sharply in September — by 2.5 million barrels per day to 102.3 million barrels per day — adding a clear supply-side headwind, though geopolitical risk can still offset part of that pressure.
Today the market focuses on the weekly EIA petroleum status report, postponed from the usual Wednesday slot because of the U.S. federal holiday on 12 October.
The data cover crude, gasoline, and distillate inventories and remain a key short-term driver.
Geopolitics stays an independent risk factor: the conflict with Iran and threats to shipping near the Strait of Hormuz raise the possibility of supply disruptions, even as higher output from several producers limits the overall impact. Reports indicate that attacks on vessels in the Strait of Hormuz have reached their highest level since the start of the U.S.–Iran confrontation.
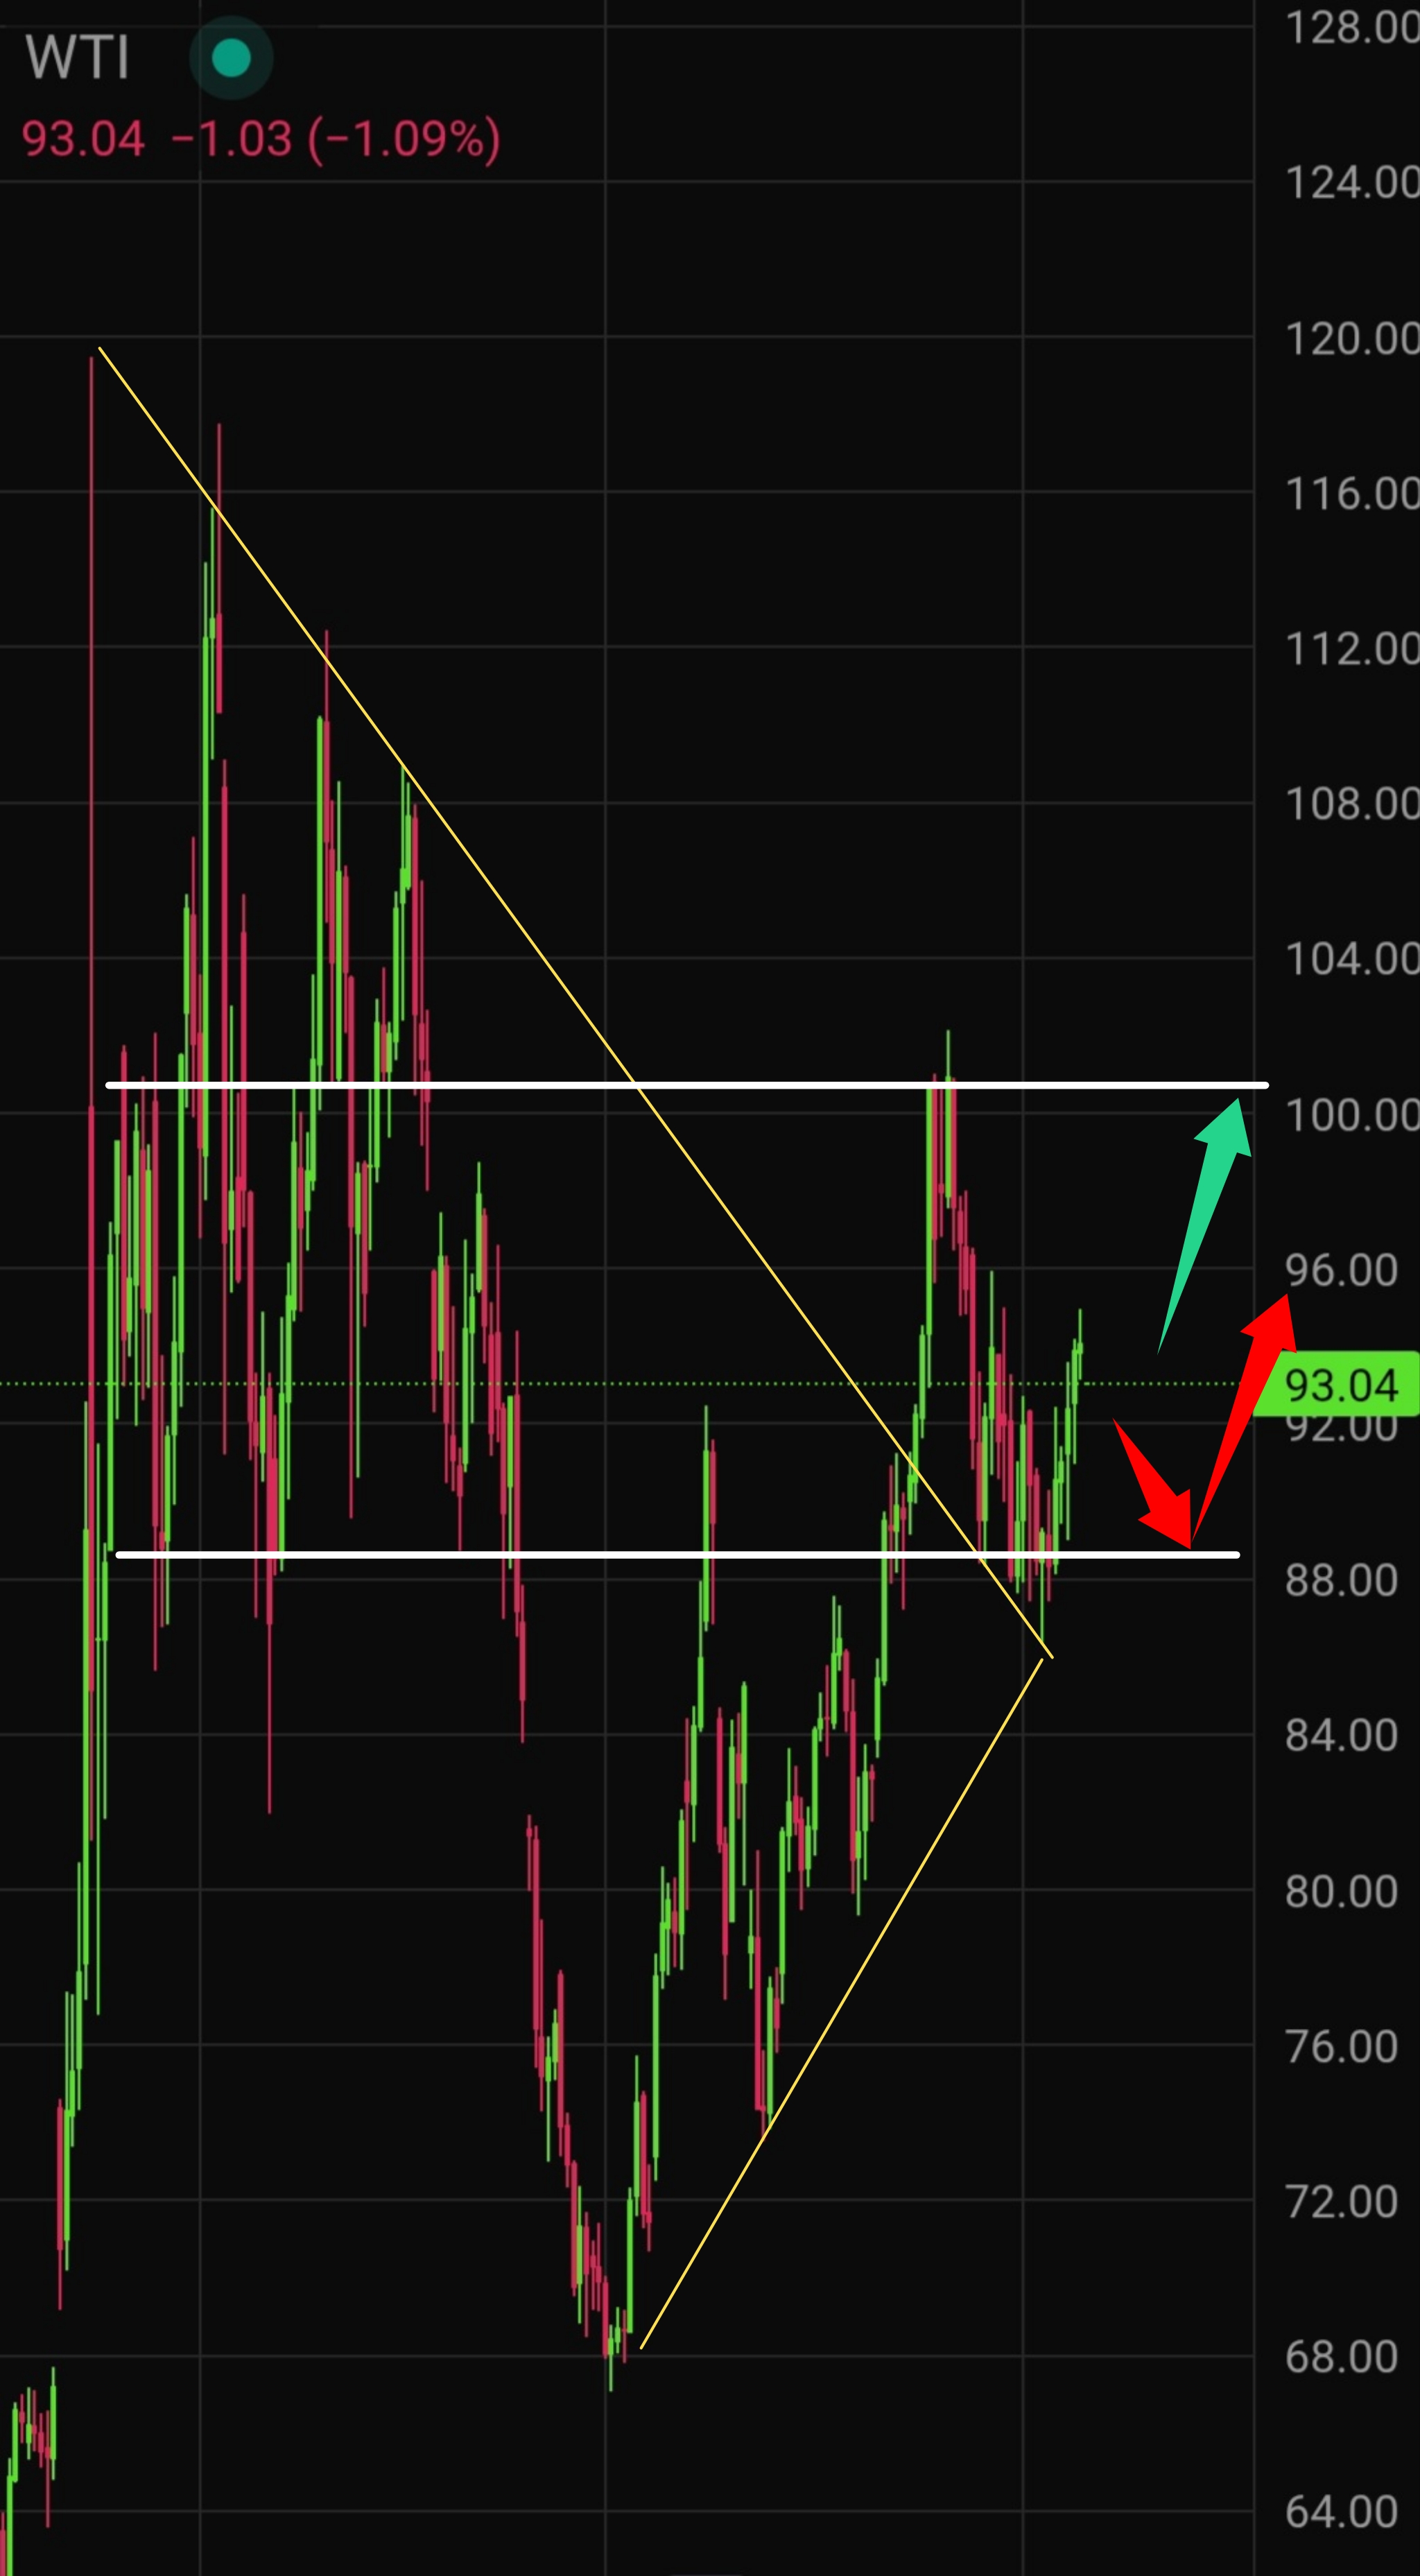
On the daily chart, even a substantially deeper pullback (for example toward $88) would not alter the overall ascending character of the structure.
Oil Price Forecast for Tomorrow
The immediate outlook hinges on the EIA inventory figures and any fresh developments around Middle East shipping. A modest recovery or consolidation is the more probable path if the report does not show a large unexpected build
Will oil go up tomorrow? It is possible. A decline into the $88.00–$92.00 zone that meets sufficient demand could set the stage for a rebound.
The weekly Baker Hughes rig count will also be watched as a secondary indicator of U.S. drilling activity, though it is not a direct measure of current production. No separate major U.S. inventory release is scheduled for Friday; today’s EIA report is the key data point. The dominant theme remains the balance between supply-disruption risk and softer demand expectations.
Oil Price Forecast for This Week
Key events this week include the potential OPEC Monthly Oil Market Report on 15 October and ongoing monitoring of Middle East supply disruptions and any strategic-reserve releases.
Inventory draws and logistical interruptions continue to underpin prices, while rising stocks or improved export flows would weigh on the complex.
Geopolitics can easily override the data.
| Date |
October 12 – October 16, 2026 |
| Minimum | $88,98 |
| Average | $91,98 |
| Maximum |
$95,00 |
Oil Price Forecast for the Next 30 Days
OPEC+ has confirmed no change to November output targets; the next ministerial meeting is scheduled for 1 November.
Geopolitical tensions continue to broaden, with reports of Pakistan and Turkey agreeing under the Mecca framework to supply forces and rapid-deployment assets to Saudi Arabia.
Middle East crude exports have recovered from early-year lows, yet tanker attacks have increased.
Notable scheduled events:
- Weekly: EIA U.S. inventory data
- 14–15 October: U.S. CPI/PPI and retail sales
- 28 October: Federal Reserve rate decision
- 29 October: U.S. Q3 GDP (advance)
- 1 November: OPEC+ meeting
The 30-day WTI price outlook next month continues to lean higher on limited supply, low inventories, and the absence of additional OPEC+ barrels. The main risks remain a faster-than-expected recovery of Hormuz flows and any clear signs of softening demand. WTI day-to-day forecasts will stay sensitive to inventory prints, while the broader WTI price target hinges on the pace of Middle East supply normalization and the 1 November OPEC+ decision.
Oil Price Analysis and Forecasting Methodology
Our oil forecast methodology combines fundamental analysis of supply-demand balances, OPEC decisions, inventories and geopolitical risks with technical analysis of price charts, trends and key levels. We also factor in market sentiment from positioning data and news flow. This multi-layered approach to calculating oil price forecasts delivers balanced, data-driven projections you can rely on.
Is Oil a Good Investment?
Is oil a good investment? With ongoing energy demand, limited supply flexibility and geopolitical premiums, oil remains a strong portfolio diversifier in 2026. Should I invest in oil? Many investors use it to hedge inflation and capture potential upside. Start your oil investment 2026 journey today — open an account and begin trading in minutes.
Summary
WTI remains supported by geopolitical risk and tight supply, yet faces headwinds from lower demand forecasts and higher global production. Near-term direction depends on today’s EIA data and Middle East developments; the broader 30-day picture stays constructive provided supply disruptions persist and OPEC+ maintains its current stance.
Crude Oil Price Forecast FAQs
What is the current price of Crude Oil now?
October 16, 2026
$96.09
When Will Oil Prices Drop?
A sustained break below $93.50 support would open the path toward $91.00. Broader downside pressure would require confirmation of rising U.S. inventories, normalized Middle East exports, and weaker demand signals from upcoming economic data.
Will Oil Rise or Fall Next Week?
The preferred scenario remains mildly bullish while price holds above $93.50, targeting $95.00–95.50. However, dense resistance and potential inventory builds or geopolitical de-escalation could keep the market range-bound or trigger a corrective dip.
How Do We Do Oil Technical Analysis?
We combine chart patterns, support/resistance, moving averages, RSI and MACD with fundamental factors like supply data, inventories and geopolitics. This integrated approach strengthens trend signals and improves forecast accuracy in our oil reviews.
How to Trade Oil Technical Analysis?
Follow the ready technical setups and levels provided in our daily oil reviews. We already combine indicators with fundamental context, so you receive clear entry zones, targets and risk parameters without extra work.
Khaled Kamal is a Market Analyst & Business Development Manager at Investizo with several years of experience in the financial services industry. His areas of focus include forex markets, trading strategies, risk management, copy trading and the practical aspects of financial markets.
Award history
More about awards
2023—2025 - 8 awards archived